
By Simon Horton, Research Officer, Avalanche Canada
This article was originally published in The Avalanche Journal, Volume 139, Summer 2025
INTRODUCING SNOWPACK.AVALANCHE.CA
Last winter, Avalanche Canada and the Simon Fraser University Avalanche Research Program (SARP) launched an open snowpack model dashboard at snowpack.avalanche.ca. The dashboard provides a daily overview of simulated snow and avalanche conditions across Canada
and neighbouring U.S. states. These forecasts come from a fully automated model chain fed by weather data from Environment and Climate Change Canada (ECCC).
This tool is not a replacement for human expertise or field observations. Instead, it adds another stream of information that highlights regional patterns, fills gaps when observations are limited, and helps forecasters spot trends in the snowpack. In this article, I’ll show how this model chain works and share tips for integrating it into operational workflows.
DEVELOPMENTS AT AVALANCHE CANADA
The dashboard’s origins go back to 2011, during ASARC research at the University of Calgary, when Sascha Bellaire first ran the Swiss SNOWPACK model using numerical weather prediction (NWP) data instead of traditional weather station inputs. Since then, Avalanche Canada has collaborated on research to refine these methods, culminating in an operational dashboard in 2021.
Over the past five years, its internal use has steadily grown. While some forecasters rely on it more than others, most have found it valuable in some type of tricky situation. Day-to-day, we have used the dashboard to track regional snowfall during storms and to monitor persistent weak layers in data-sparse areas. It’s not yet central to our workflow, but the recent addition of simple hazard metrics and clustering algorithms has made it much easier to scan and validate regularly.
HOW THE MODEL CHAIN WORKS
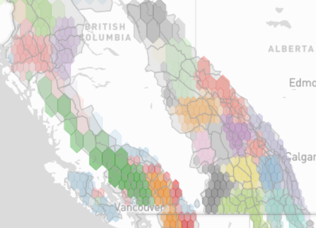
The tool predicts snow and avalanche conditions with a multistep model chain run on a 2.5 km grid covering areas with avalanche terrain (Fig. 1). It starts with weather forecasts from ECCC: the High Resolution Deterministic Prediction System (HRDPS) provides data for the first 48 hours, and the Regional Deterministic Prediction System (RDPS) extends the forecasts to 84 hours. These forecasts are elevation-adjusted to the typical start-zone elevation in each grid cell, making them more representative of weather in avalanche terrain (see inset
below).
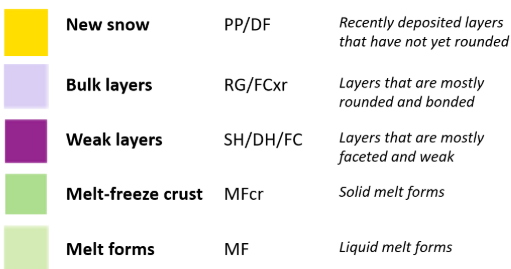
Next, the weather data are fed into the SNOWPACK model to simulate how the snowpack evolves over time, producing profiles in each grid cell for flat ground as well as 38° slopes facing north, east, south, and west. Finally, post-processing tools scan the simulated layers for key features such as new snow amounts, wet snow, and persistent weak layers. These results are then summarized as maps, charts, and text for easy interpretation on the dashboard.
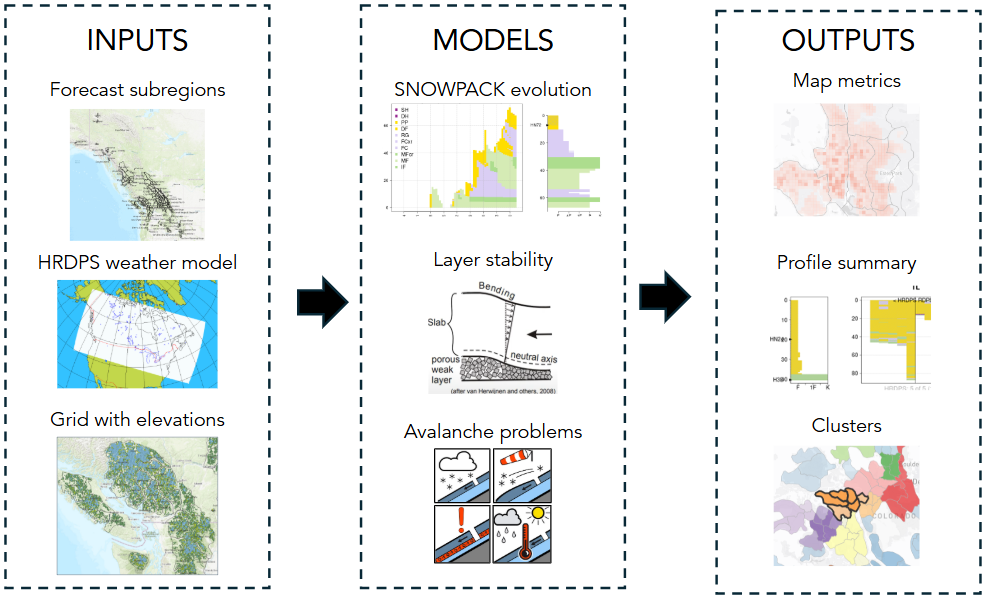
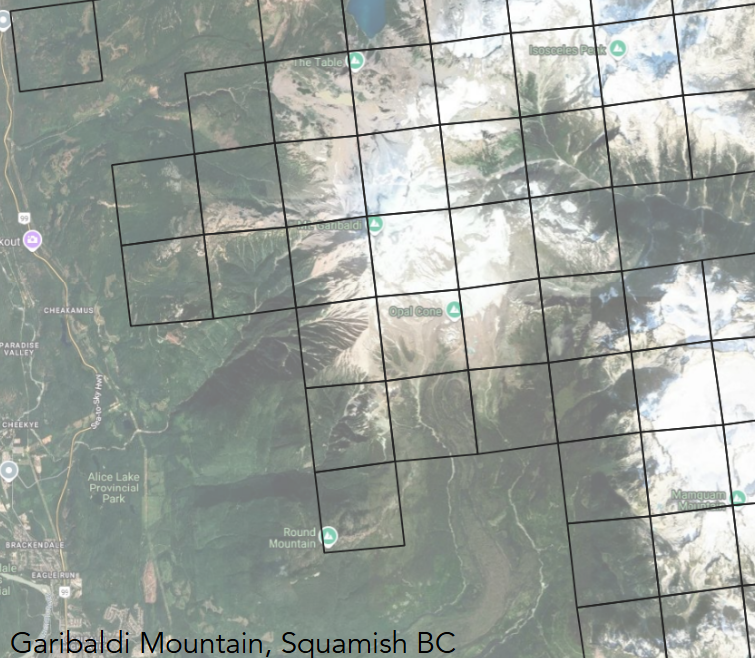
The model is designed to represent weather conditions as realistically as possible in avalanche terrain. Its foundation is the 2.5 × 2.5 km grid cells of the HRDPS. However, because weather models smooth over mountains and valleys, we added several steps to make the simulations more relevant for avalanche forecasting.
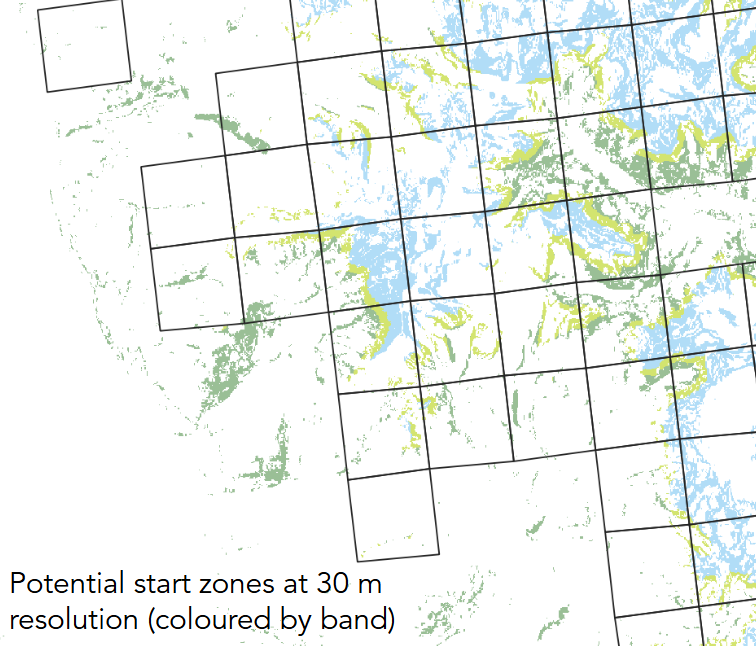
The first step was to identify where avalanches could actually start. We used three high-resolution datasets at 30 m resolution: a digital elevation model (ALOS) to identify slopes between 30–60°, land cover data (NALCMS) to identify open terrain, and PRISM climate data to identify regions with more than 200 mm of annual snowfall. Any 30 × 30 m pixel that met these criteria was treated as a potential start zone. HRDPS grid cells that did not contain any potential start zones were excluded from the model.
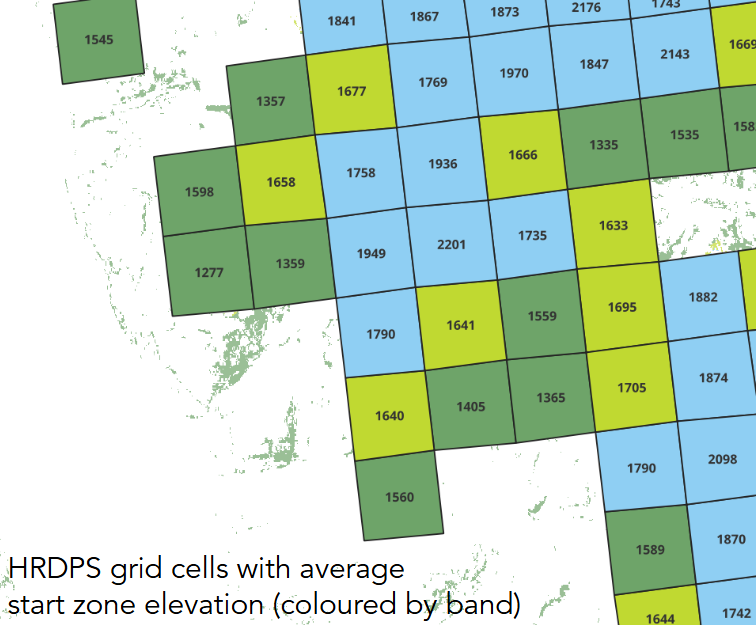
For the remaining cells, we calculated the average elevation of the mapped start zones. We then adjusted HRDPS and RDPS temperature forecasts to this elevation. This correction was important because weather models smooth out higher peaks, so adjusting for elevation gave more accurate estimates of temperature and precipitation type.
Finally, each cell was assigned to an elevation band (e.g., below treeline, treeline, alpine) based on the typical treeline elevation in that region. Treeline was derived from the land cover dataset by identifying the highest elevation where forested terrain is present.
HOW TO USE THE DASHBOARD
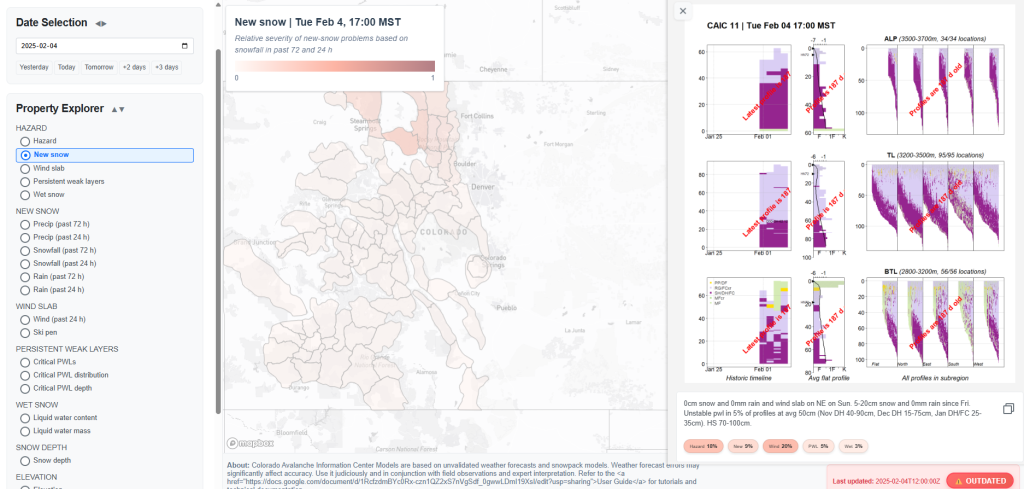
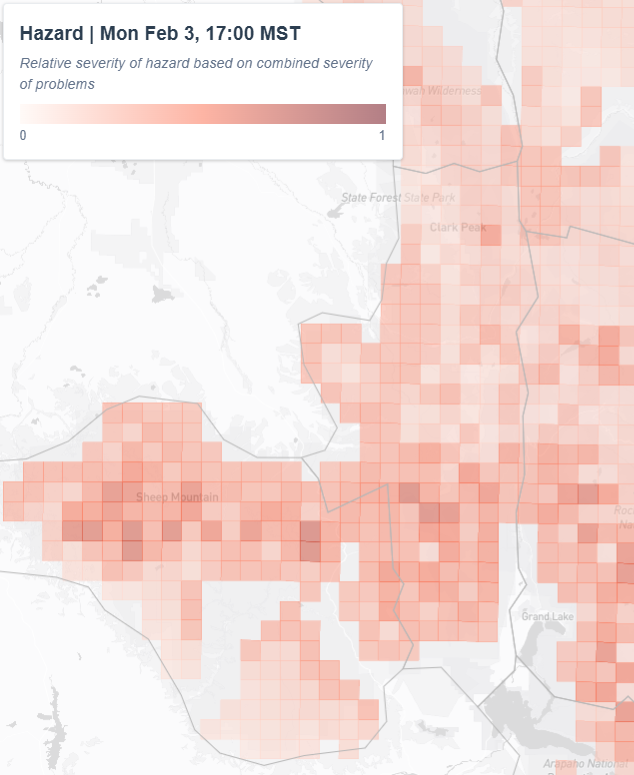
The dashboard is best used with a forecast funnel approach—start broad, then zoom in (Fig. 2). Begin with the map to see what’s driving hazard at the mountain range scale. Hazard heatmaps show relative scores for overall hazard, along with contributions from new snow, wind slabs, persistent weak layers, and wet snow (see right inset).
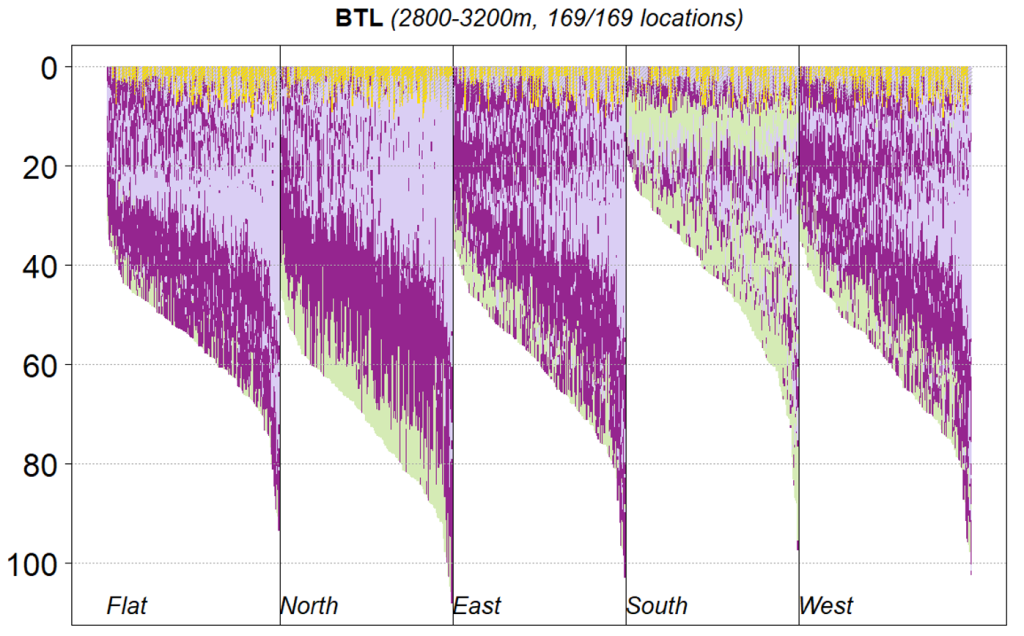
From there, dive deeper into specific variables like 24- or 72-hour snowfall, or the depth and distribution of unstable persistent weak layers. Clicking a location on the map opens a sidebar with snowpack graphics and summary text. The graphic splits information into elevation bands and aspects (Fig. 3). Continue zooming in on the maps to see data disaggregated into the 2.5-km grid cells.
Think of the dashboard as a first scan of conditions. It can highlight areas worth closer attention, raise questions where data are sparse, or help confirm expectations. Do not expect it to give a “correct” answer, but rather to provide consistent, automated information to help guide your attention.
NEW THIS SEASON
The dashboard will soon be available as an option within InfoEx workflows. When setting up a workflow, you’ll be able to add a custom URL that embeds the dashboard directly into InfoEx, already zoomed to your area of interest. This should make it easier to bring model simulations into your daily process.
A short, optional survey tool will also be available, giving you a quick way to share feedback on the accuracy and usefulness of the simulations. This input will help SARP researchers understand how well the model aligns with field conditions and how well it supports your operational decisions. Some operations may also be invited to take part in detailed surveys or targeted evaluations, so keep an eye out for requests from the SARP team.
This lightweight integration marks an early move toward incorporating modelling and AI tools into day-to-day forecasting. The effectiveness of these tools depends heavily on training and validation data—and InfoEx provides a rich foundation for these developments.
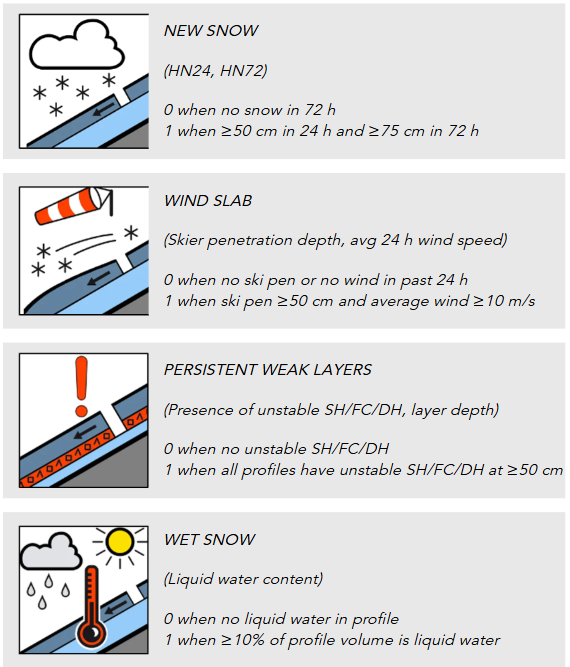
The model chain summarizes thousands of simulated snow profiles with a few key hazard metrics. These are based on four simplified avalanche problem types from the European Avalanche Warning Service: new snow, wind slab, persistent weak layer, and wet snow. Unlike the familiar North American problems—focused on risk management and harder to quantify—these categories tie directly to the physical processes modelled in SNOWPACK. For each problem, the model extracts relevant snowpack and weather variables and translates them into a severity score from 0 to 1—where 0 means the problem is unlikely and 1 means the problem has very likely widespread, large
avalanches. An overall hazard score is then created by averaging the two most severe problems. These metrics are intended as broad signals of hazard trends, not exact predictions. Research at SARP is underway to refine and improve these methods.
GENERAL PERFORMANCE LAST WINTER
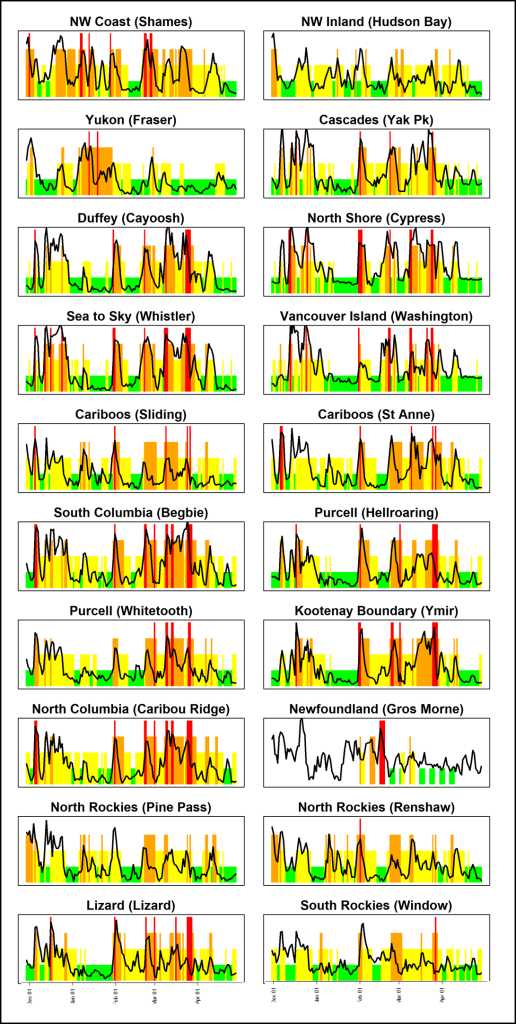
To give you a general sense of how the model captures hazard trends, we looked at 20 locations across different mountain ranges over the 2024-25 winter (Fig. 4). The black lines show the model’s hazard metric at these locations compared to the treeline danger rating issued by Avalanche Canada.
Overall, there’s good correlation—rises and falls in danger ratings are usually aligned with the model. Interestingly, the model has a tendency to lead the forecast when it comes to increasing or decreasing hazard. This could be because forecasters often wait for field observations to confirm changes, while the model may anticipate these trends earlier. The model also highlights more subtle changes during periods of static danger. For example, we might sit at moderate for a week, but the model will show a slow decline from the higher to lower end of moderate over that period. That said, there are clear errors, too. A good example is in March at Lizard near Fernie, where the model failed to indicate a sharp rise to high danger. This was a classic “Fernie Factor” event, where the NWP models dramatically under-called a 60 cm storm.
Overall, the comparison shows a general correlation, but model performance varies widely across locations. Understanding the timing, location, and causes of these discrepancies is essential for validating the model chain and improving future tools. To support this, SARP is conducting ongoing validation research and welcomes your feedback through the InfoEx survey.
Based on operational experience at Avalanche Canada and my personal involvement in developing the model chain, here are some ways I think the dashboard can support forecasting, along with the main limitations to keep in mind:
| STRENGTHS | WEAKNESSES |
| – Regional patterns: The model has a unique ability to reveal broad spatial trends and cluster similar snowpack conditions across mountain ranges, helping you see beyond local point-scale observations. – Elevation and aspect trends: Profiles for a region show general trends in how the snowpack changes across elevation bands and aspects. – Tracking new snow and settlement: In many regions, the model reliably tracks recent snowfall, timing, and settlement. This is especially useful during multi-day storms or when returning to an area after time away. – Visualizing key layers: Viewing simulated depths of weak layers and crusts helps build a mental model of the snowpack structure, which can be difficult to infer from sparse field observations. – Early-season: When field data are limited or missing, the model helps fill observational gaps and gives a sense of how the snowpack is developing. For example, are there early-season rain crusts and are they faceting? – Monitoring problem evolution: By showing how layers change over time, the dashboard can hint when persistent weak layers or other problems are beginning to stabilize. | – Time of day matters: Forecasts reflect afternoon conditions (0 UTC or 4/5 PM Pacific) and update in 24-hour steps. Keep this in mind for processes with finer timing, such as overnight surface hoar growth, afternoon melt, or daytime snowfall. – Data-gaps happen: Check timestamps and watch for error messages—delays in ECCC weather data or occasional model bugs can result in outdated information and misleading results. – Precipitation is the biggest source of error: Issues with timing, type, or amount of precipitation can throw off snowpack evolution and hazard metrics. Use precipitation maps and historic profile timelines to judge if patterns seem reasonable. – Climate affects error sensitivity: In maritime climates, precipitation errors tend to stretch or compress the snowpack, but preserve structural features. In continental climates, they can more drastically affect temperature gradients and snowpack structure. – Persistent weak layers are tricky: Their formation is highly sensitive to atmospheric conditions. Rather than focusing on a single point, examine regional patterns to see if past conditions favoured weak layer formation, then consider the modelled amount of snow above the layer, which strongly influences the stability predictions. – Wind slabs are poorly resolved: The simulated stratigraphy does not capture wind stripping or deposition. Additionally, the wind slab hazard metric is unvalidated and intended only to indicate where and when new wind slabs may be forming—not their size or likelihood. |
COLLABORATORS
The dashboard has been developed through a joint effort between Avalanche Canada, SARP, ASARC, and the broader avalanche community. In 2023, collaboration expanded internationally with AvaCollabra—a network of model developers, researchers, and forecasters working to improve operational snowpack modelling. Insights from this group have helped us refine methods and shape best-practices for future developments.
Momentum is also building around AWSOME (Avalanche Warning Software for Operational Modelling Environments), an open-source platform created by the Tyrolean avalanche warning service for sharing snowpack modeling code. We are working to integrate the Canadian model chain into AWSOME to streamline collaboration across agencies and research groups. Anyone interested in contributing or following progress is encouraged to explore these groups.
FUTURE VISION
The dashboard represents an important step in making snowpack and avalanche hazard modeling accessible to the wider Canadian avalanche community. Looking ahead, we aim to increase spatial resolution beyond the current 2.5 km grid, capturing finer terrain features and snowpack variability. Real-time data assimilation—incorporating observations from field reports, remote sensors, and user feedback—will be key to keeping model predictions accurate and trustworthy.
We also plan to move toward probabilistic forecasts. Rather than a single deterministic output, multiple weather scenarios will produce a range of predictions, allowing the dashboard to convey confidence levels and support more informed decisions by forecasters. Deeper integration with operational workflows is another priority. Embedding the dashboard directly into forecasting tools will make model predictions easier to access alongside other information streams and could eventually support semi-automated forecast products.
Collaboration remains essential. By engaging forecasters, researchers, and users through feedback and shared development, the tool can evolve to meet practical needs and scientific advances. Ultimately, these efforts aim to make model-based predictions a trusted resource for safer travel and improved avalanche risk management across Canada’s mountains.
Predicting avalanche danger and problems across terrain: PhD student Martin Perfler is developing methods to translate point-scale snowpack simulations into regional-scale predictions of avalanche problems and danger levels.
Improving calibration, data assimilation, and uncertainty estimates: Postdoc Florian Herla is assembling validation datasets—including avalanche observations and hazard assessments—and exploring ways to correct the model output at the start-zone scale. He will also apply
ensemble techniques to produce probabilistic forecasts.
These projects aim to make the model more accurate,reliable, and useful in day-to-day operations.
ACKNOWLEDGEMENTS
Many people have contributed to this tool. Avalanche Canada provided substantial resources through its software development team and valuable feedback from warning service staff. Graduate students at SARP and ASARC made significant contributions to the underlying methods, and many members of the CAA also contributed. We thank ECCC for the data needed to run the models and the Swiss SLF institute for the open-source SNOWPACK model.