By Peter Barsevskis
INTRODUCTION
A predictive measurement used in avalanche forecasting is snow hardness, which is a measure of the snow’s resistance to penetration by an object (Fierz et al., 2009). The resistance is due to the combination of snow grain bonds and structures, bending, rupturing, and compacting; along with the friction between the snow and the penetrating object (Borstad & McClung, 2011).
The first mechanical measurements of snow hardness were taken in 1936 using the Swiss rammsonde, a metal probe driven into the snow by the observer dropping specified weights on the probe (Haefeli, 1954; Höller & Fromm, 2010). Although capable of measuring snow hardness, it was unable to detect thin weak layers associated with slab avalanches (Schneebeli & Johnson, 1998).
The current standard for measuring snow hardness in Canada is the hand hardness test, introduced by Marcel de Quervain in 1950 (Canadian Avalanche Association, 2016). The test has the operator exert 10-15 N of force using physical objects of decreasing surface area (fist, 4-fingers, 1-finger, pencil, and knife) into the snowpack. This standard has been set by “The International Classification for Seasonal Snow on the Ground” (Fierz et al., 2009). Furthermore, the CAA has operators add + and – indicators to illustrate variations in hardness (Canadian Avalanche Association, 2016). However, this test has shortcomings in accuracy due to bias amongst users, failure to consistently apply 10-15 N, misusing ± classifications, and varying hand sizes (Pogue et al., 2018).
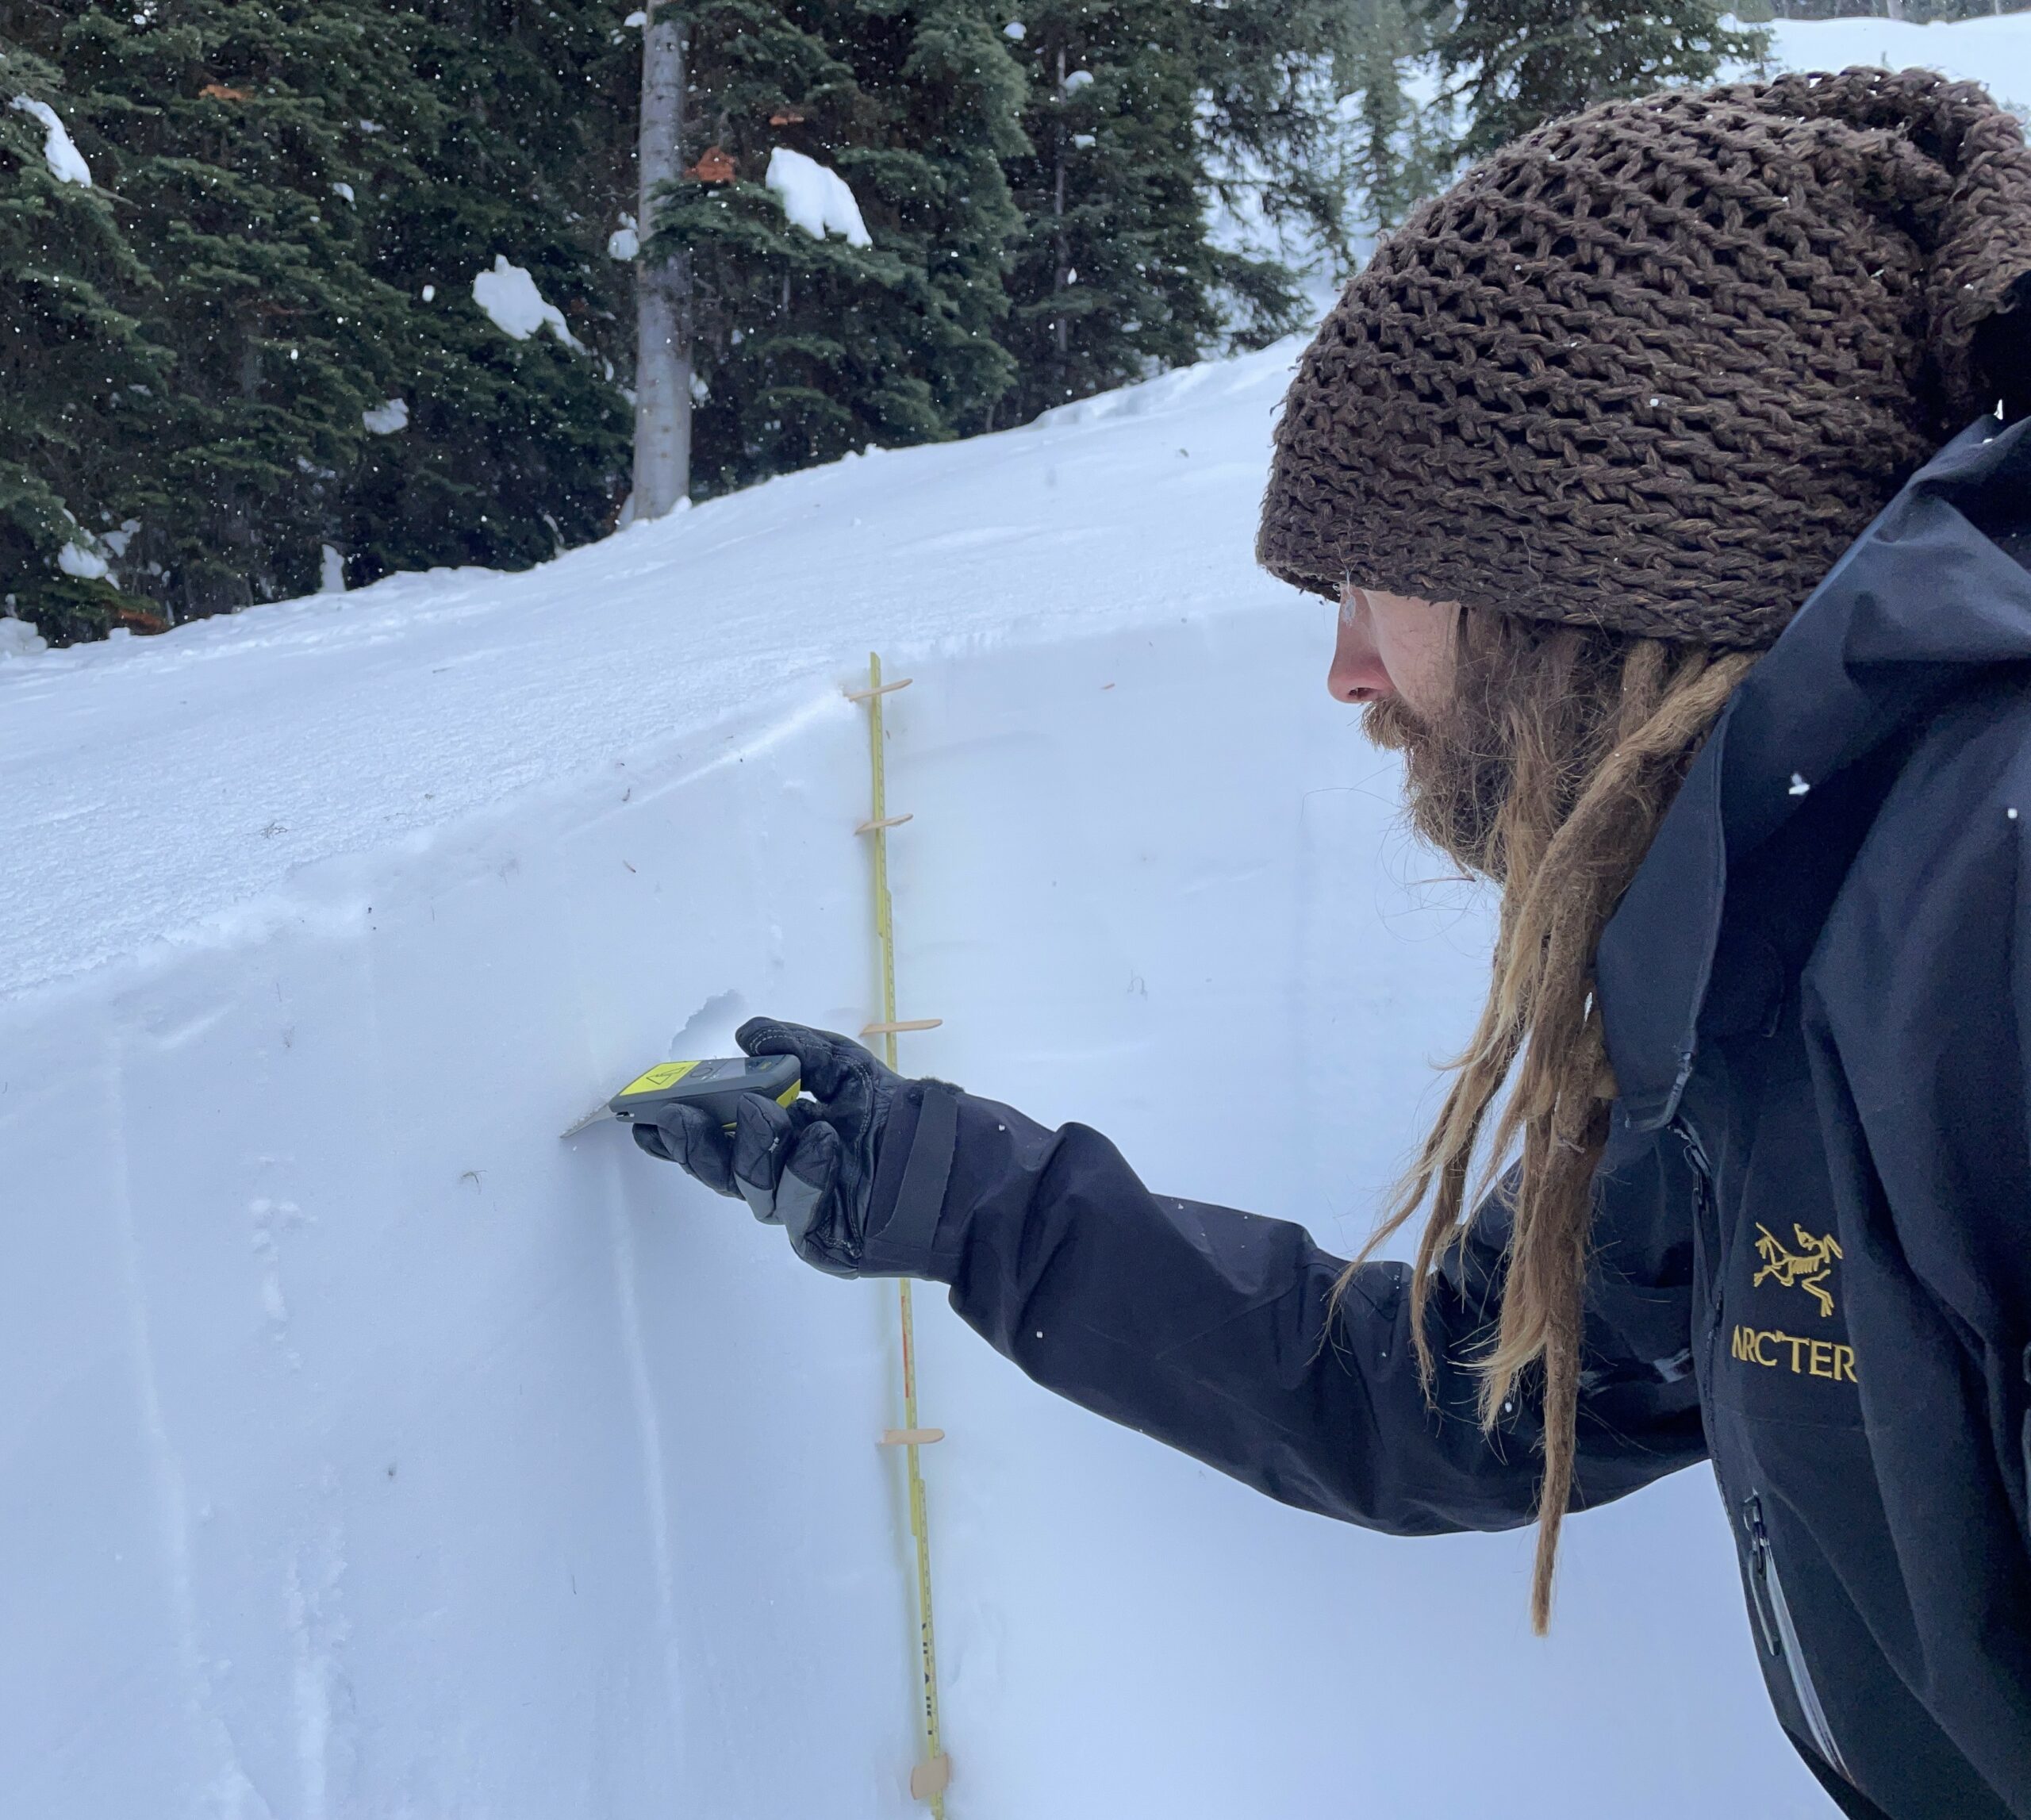
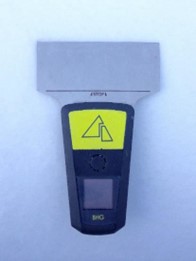
A promising technology to address these shortcomings is the blade hardness gauge (BHG). This work investigates the reliability and integrity of the BHG with respect to measuring snow hardness. The BHGs used in this study were the third and latest model produced by Fraser Instruments Ltd. (Fig. 1). The blade is stainless steel, 0.6 mm thick, 10 cm wide, has a force range of 0–50 N and is precise to 0.05 N. It measures and displays the peak resistance hardness as the blade is inserted into the snowpack.
The BHG is based off the thin-blade tool introduced by Borstad and McClung (Borstad & McClung, 2011). The thinblade device allows the avalanche practitioner to measure the hardness of thin weak layers over time (Pogue & McClung, 2016). A Parks Canada study comparing the BHG and the hand hardness test concluded the ± indexes had no meaning, that fist and four-fingers hardness was basically the same, and
that further testing was needed for operator bias (Pogue et al., 2018).
OBJECTIVES
This research had the following objectives:
- Determine if there is a difference in recorded BHG measurements between fast (? 10 cm/s) and slow (? 1–3 cm/s) insertion rates into the snowpack.
- Determine if there is a difference in recorded BHG measurements depending on the orientation of the BHG into the snowpack.
- Find a correlation between BHG measurements and the hand hardness test.
- Test the replication of the hand hardness test versus the BHG amongst avalanche technicians.
METHODS
This study occurred over the 2020–21 and 2021–22 winters. The primary field sites were within the Kicking Horse Mountain Resort tenure and the surrounding backcountry in Golden, B.C. Additional field data was gathered in the Canadian Rockies, Rogers Pass, Big White Ski Area, and Whistler Blackcomb.
The snow profiles carried out in the designated study sites adhered to the observation and recording guidelines set forth by the CAA (Canadian Avalanche Association, 2016). Further observations were made using the BHG.

Insertion rate
The BHG was inserted into the snowpack at both fast and slow rates, at the same depth and at the same angle (slope parallel). The insertions were spaced roughly 2 cm apart. To determine the consistency of fast versus slow measurements, a second experiment was completed where layers of homogenous snow greater than 10 cm in height were used to complete 10 fast and 10 slow measurements. The BHG was inserted perpendicular to the slope angle to reduce spatial variability of the snowpack in relation to snow layering. This procedure was carried out in multiple layers of snow differing in snow hardness.
In both experiments, the velocity of insertion rates was standardized through timer and ruler-based measurements, where velocity was the measure of the distance covered in a given amount of time. These calibrations were conducted inside by the researcher before venturing into the field. During fieldwork, the researcher subjectively assessed the insertion rates.
Orientation
The natural snowpack is made up of different stratigraphic layers as the snowpack transforms throughout the winter season. Due to elevation, terrain, weather, and snow metamorphism, there is a range of snow hardness throughout the snowpack. This research explored the orientation of the BHG with insertions parallel and perpendicular to the snowpack to measure the snow hardness. Homogenous snowpack layers with a height of 10 cm or more (determined through a combination of visual and physical methods in excavated snow profiles) were used to compare six horizontal BHG measurements (blade parallel to the slope) and one vertical BHG measurement (blade
perpendicular to the slope). For the horizontal measurements, intervals of 2 cm were employed vertically, resulting in a cumulative vertical height of 10 cm. The vertical measurement was obtained over the entire 10 cm distance. Both horizontal and vertical measurements were spaced roughly 2 cm apart and their corresponding values were documented.
Hand hardness
Blade hardness measurements were conducted in conjunction with the respective hand hardness profiles, with the aim to quantitatively gauge the hand hardness scale. An avalanche technician recorded hand hardness for each layer, while the researcher performed BHG measurements at approximately 2 cm intervals within the layers to ensure uniform measurements. The insertion rate for all BHG measurements was maintained at approximately 10 cm/s, with the researcher subjectively assessing the rate.
To assess the repeatability of both the hand hardness test and the BHG, avalanche technicians sequentially executed hand hardness and BHG measurements. Each technician was unaware of the measurements taken by the others to ensure independence. The technicians were instructed to carry out BHG measurements with a consistent, rapid insertion rate of approximately 10 cm/s, every 2 cm within the layers. These sets of measurements were obtained from the same snow profile, with minimal time gaps between technicians to mitigate weather-related influences, and minimal spacing to mitigate spatial variability effects in the snowpack.
RESULTS
Insertion rate
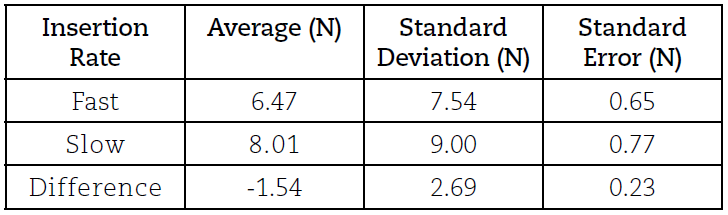
Pairs of BHG measurements were taken to test if there was a difference in BHG measurements with respect to fast and slow insertion rates. A total of 136 in situ pairs were taken in snow profiles consisting of dry snow ranging in blade hardness 0.1 N to 36.2 N (Table 1). The data supports there is statistically significant difference between the fast and slow rates (WS = 1938.00, p < 0.01).
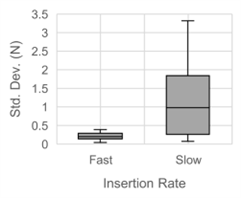
To test the consistency of the insertion rates, trials of 10 fast and 10 slow measurements were taken in layers of homogenous snow greater than 10 cm in height. This procedure was carried out in multiple layers of snow differing in snow hardness, resulting in 11 trials for consistency. A fast insertion rate resulted in more consistent measurements than a slow rate (Fig. 2).
Orientation
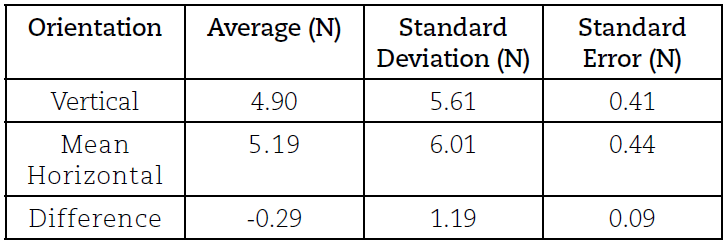
186 vertical BHG measurements (height of 10 cm) were compared with 186 mean horizontal measurements in homogenous layers of dry snow greater than 10 cm in height (Table 2). The data supports there is a statistically significant difference between the two BHG orientations (WS = 6206.00, p< 0.01).
Hand hardness
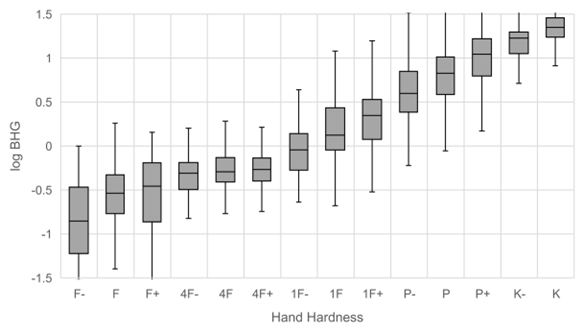
A total of 68 hand hardness profiles by 33 avalanche technicians were taken, along with corresponding BHG measurements. The technicians classified the hand hardness test with the five hand hardness indices (F, 4F, 1F, P and K) and the ± indices. A total of 4,229 BHG measurements were compared with the hand hardness indices (Fig. 3).
To see if there was a difference in the hand hardness indices based on experience, the data from the hand hardness profiles was split up based on the avalanche technician’s certification. A total of 36 profiles were taken by 20 different avalanche technicians with Avalanche Operations Level 1, and 19 profiles were taken by 13 technicians with Avalanche Operations Level 2, along with corresponding BHG measurements (Fig. 4).
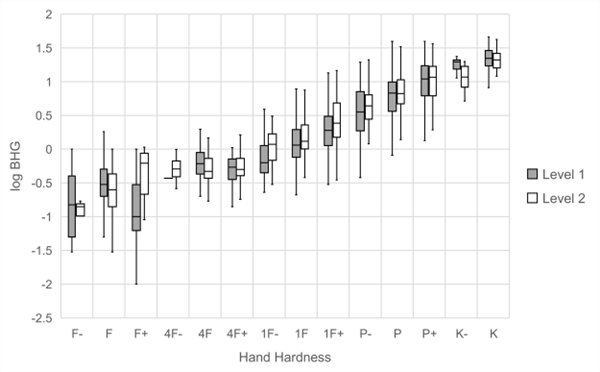
The log box plots seen in Figures 4 and 5 visualize the overlap in the data between the hand hardness values. Comparing blade hardness with hand hardness shows significant overlap between the neighbouring hand hardness levels. The log scale of the blade hardness forms an almost linear relationship with the hand hardness as the surface area of each hand hardness level decreases.
To test the reproducibility of the hand hardness test and the BHG, avalanche technicians took corresponding hand hardness and BHG measurements one after another. Throughout the research a total of 286 snow layers were compared with the hand hardness test and 208 snow layers were compared with the BHG. The results are shown in Figure 5.
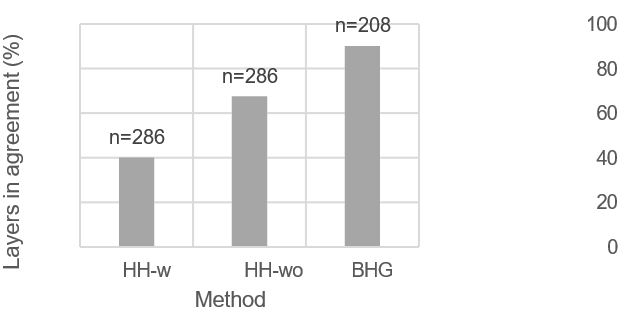
Figure 5 indicates the percentage of layers in agreement between avalanche technicians was 90.4% when using the BHG, in contrast to 40.2% when employing the hand hardness test with the ± indices. This highlights the superiority of the BHG over the hand hardness test in measuring snow hardness amongst avalanche technicians. Excluding the ± notations, the consistency of the hand hardness test amongst avalanche technicians increased significantly to 67.8%.
DISCUSSION
The rate at which the BHG is inserted into the snowpack holds significance in achieving uniformity amongst users. This research investigated both fast (? 10 cm/s) and slow (?1-3 cm/s) insertion rates. The analysis revealed a statistically significant disparity between the two rates, with slow insertion giving larger hardness values. Faster insertion rates tended to give lower variability and better consistency. By comparing these findings with existing literature (Bradley, 1966; Fukue, 1977) it is advisable to employ an insertion rate of approximately 10 cm/s into the snowpack to ensure consistency amongst users. Adequate training should be provided to BHG users to maintain a consistent and fast insertion rate.
With regards to orientation of the BHG, the data supports a statistical difference between one perpendicular measurement and the average of six parallel measurements. There is variation amongst the measurements, especially in non-homogenous snow layers. The recommendation is to insert the BHG parallel to the snowpack in two-centimetre increments, with extra measurements taken at the location of persistent weak layers to gain the most precise hardness profile.
As the hand hardness test is the current standard for measuring snow hardness in Canada, this research set out to further correlate the BHG with the hand hardness test. The data from the 68 hand hardness profiles with correlating blade hardness measurements, seen in Figure 4, resulted in no difference between the ± indices in the four fingers category. The data from the 19 hand hardness profiles from CAA Level 2 operators, seen in Figure 5, resulted in no difference between F+, 4F-, 4F and 4F+ indices. This illustrates avalanche technicians have a hard time distinguishing hardness difference in soft snow and that the ± indices do not have meaning in soft snow. These results are similar to what Pogue et al. found (2018).
A comparison of hand hardness and BHG profiles amongst users showed BHG measurements were more consistent amongst users than the hand hardness test.
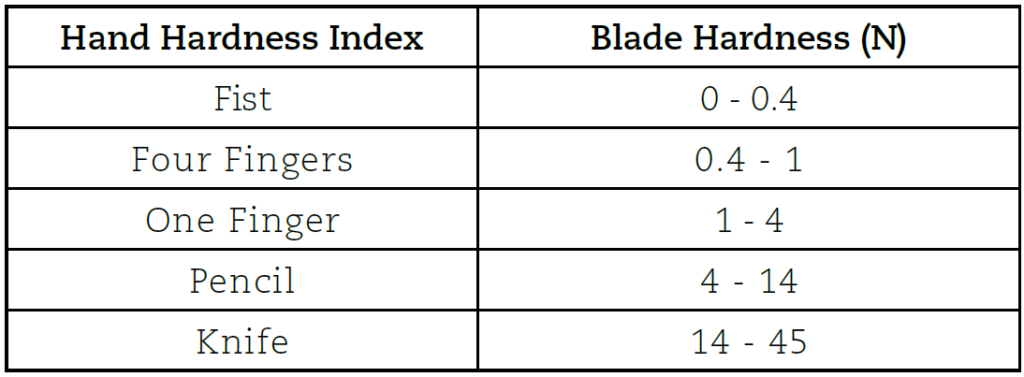
Data from this research was used to create a blade hardness to hand hardness scale as seen in Table 3. The BHG can be used as a teaching tool to introduce and improve consistency of the hand hardness test amongst users. It offers the users the ability to feel what 10-15 N of force feels like, which is the insertion force of the hand hardness test. By measuring the blade hardness, the user can identify the corresponding hand hardness by using the provided scale. Continuous calibration of the hand hardness test with the BHG could lead to greater consistency amongst avalanche technicians.
The outcomes of this research suggest the removal of the ± indices from the hand hardness test would enhance the reproducibility among avalanche technicians. However, within a single snow profile, a particular avalanche technician can utilize the ± indices to assess hardness discrepancies between snow layers in each snow profile. Those ± indices will overlap the other indices over time and will not necessarily be reproduced by another technician. For a more accurate and consistent assessment of snow layer hardness over time, it is recommended to measure the snow hardness with the BHG instead of the hand hardness test.
ACKNOWLEDGEMENTS
This research was made possible by the supervision and guidance provided by Dr. Mark Paetkau, with further guidance from Dr. Iain Stewart-Pattterson and Dr. Richard Taylor.
For supporting research and providing access to the primary field research locations, I would like to thank the entire Kicking Horse Mountain Safety team and Kicking Horse Mountain Resort.
Many thanks to the Avalanche Canada Foundation for providing financial support for this research. I would like to thank Fraser Pogue and Grant Statham for supplying the blade hardness gauges.
Thanks to Brucejack Mountain Safety for continued support for sharing and pursuing research in the avalanche community.
For great discussions of snow and avalanches, I would like to thank Steve Conger and Dr. David McClung.
REFERENCES
Bradley, C. C. (1966). The snow resistograph and slab avalanche investigations. International Association of Scientific Hydrology Publication, 69, 251–260.
Borstad, C. P., & McClung, D. M. (2011). Thin-blade penetration resistance and snow strength. Journal of Glaciology, 57(202), 325–336. www.geog.ubc.ca/avalanche/pubs/BorstadMcClung_2009_
Canadian Avalanche Association. (2016b). Observation Guidelines and Recording Standards for Weather, Snowpack and Avalanches.
Fierz, C., Armstrong, R. L., Durand, Y., Etchevers, P., Greene, E., McClung, D. M., Nishimura, K., Satyawali, P. K., & Sokratov, S. A. (2009). The International Classification for Seasonal Snow on the Ground. http://www.unesco.org/water/ihp
Fukue, M. (1977). Mechanical performance of snow under loading [PhD Thesis]. McGill University.
Haefeli, R. (1954). Snow mechanics with reference to soil mechanics. In Der Schnee und Seine Metamorphose (Translation 14, pp. 57–218). Snow, Ice and Permafrost Research Establishment.
Höller, P., & Fromm, R. (2010). Quantification of the hand hardness test. Annals of Glaciology, 51(54). https://doi.org/10.3189/172756410791386454
Pogue, F., & McClung, D. (2016). Using a thin-blade tool for measuring snow hardness and change in strength of buried surface hoar. Proceedings of the International Snow Science Work- shop, 589–593.
Pogue, F., McClung, D., & Conger, S. (2018). Parks Canada Profiles: Comparing hand hardness to thin-blade resistance. Proceedings of the International Snow Science Workshop, 908– 911.
Schneebeli, M., & Johnson, J. B. (1998). A constant speed penetrometer for high-resolution snow stratigraphy. Annals of Glaciology, 26, 107–111. https://doi.org/10.3189/1998AoG26-1-107-111
ABOUT THE AUTHOR
PETER BARSEVSKIS is an industrial avalanche technician at Brucejack Gold Mine. His avalanche career began as a ski patroller at Kicking Horse Mountain Resort. In 2022, he completed his Master of Science at Thompson Rivers University, focusing on snow characteristics with the blade hardness gauge. His home is in the mountains of Golden, B.C., with his wife and dogs.