Measuring the Explosive Airblast of Remote Avalanche Control Systems
By Robb Larson
This article originally appeared in The Avalanche Journal, Volume 130, Summer 2022

INTRODUCTION TO RACS
Remote Avalanche Control Systems (RACS) are widely deployed in Europe and installations are becoming more and more common in North America. Systems have been installed by departments of transportation, industrial operations, and ski areas to enable avalanches to be explosively triggered remotely, thus avoiding the need to put avalanche control workers in harm’s way. In some situations, RACS are taking the place of artillery rounds to remotely initiate avalanches without the hazards of shrapnel or potential for trajectory mishaps.
RACS can be based on either explosive gaseous mixtures or solid explosives. The Gazex system, from the French corporation TAS, uses a mixture of oxygen and propane that is metred into a reinforced steel tube and then remotely ignited. The tubes are permanently installed on concrete supports in an avalanche starting zone, while oxygen and propane tanks are housed in a separate on-mountain storage location and gas lines are run to one or more units. The number of firings is limited only by the local gas supply. Numerous installations of three sizes (0.8, 1.5, and 3.0 cubic meter gas capacities) are present in the western U.S. and Canada.
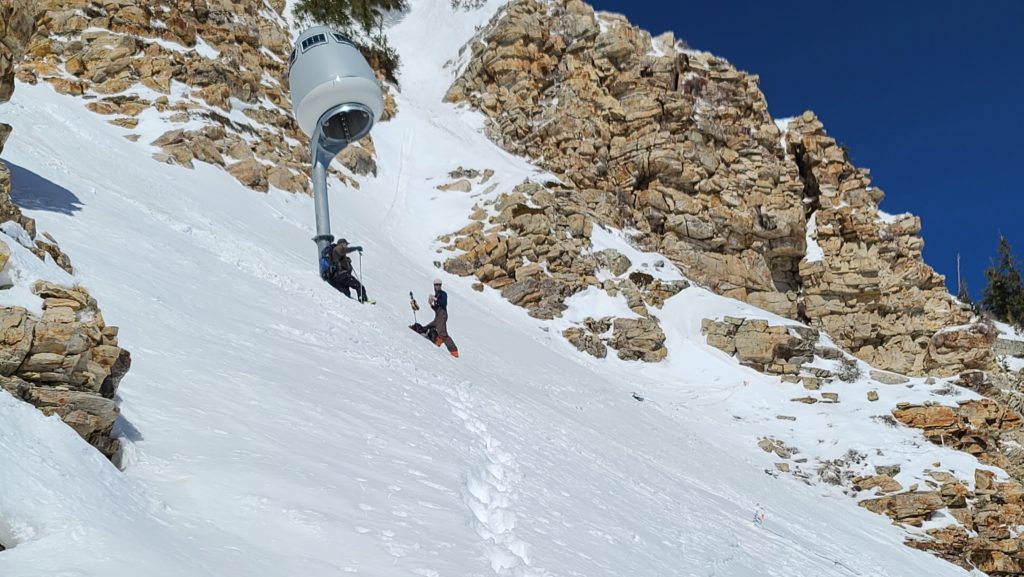
The O’bellx, also from TAS, uses a mixture of oxygen and hydrogen. Gas storage cylinders are held around the perimeter of a bell-shaped explosion chamber. The O’bellx unit is delivered by helicopter to a tower permanently installed in an avalanche starting zone. On remote command, the metred gas charge is released into the bell and ignited. The gas supply lasts for approximately 30 firings. When it is depleted, a helicopter retrieves the bell and flies to a location where the gas can be replenished. A similar but non-fixed system called the Daisy Bell is dangled under the helicopter where the gaseous mixture is released into the bell and ignited over the target starting zone.
The Wyssen Tower from Swiss manufacturer Wyssen Avalanche Control uses gel or solid explosive charges instead of gas. A tower permanently installed in the starting zone is specially designed to receive and hold a helicopter-delivered magazine containing 12 charges. Upon remote command, a tethered charge is released from the magazine. An igniter is activated when the charge hits the end of its lanyard, where it hangs and detonates at a predetermined height above the snow surface. The first Wyssen Tower in Canada was installed by the BC Ministry of Transportation in Three Valley Gap in 2016.
Another player in the field is the Avalanche Guard by Swiss manufacturer Inauen-Schatti AG. It uses a remotely actuated pre-loaded mortar to launch solid-explosive charges from a permanently installed tower. The charges land in the predetermined target starting zone up to 200 metres from the tower and detonate within the snowpack.
Despite different designs, all RACS effectively address the need to perform avalanche control activities without endangering workers. However, each system has unique characteristics, various explosive effects, and operational advantages and challenges.
STUDY ORIGINS
Many organizations worldwide are interested in RACS performance. Among these, the Transportation Avalanche Research Pool (TARP) is a partnership of entities whose mission is to improve the safety and effectiveness of avalanche mitigation operations in mountain transportation corridors. TARP was established through the United States Department of Transportation state planning and research pooled fund program and is currently administered by the Colorado Department of Transportation. Members contribute funds, develop ideas for projects, and vote on how to spend money in the pool. Currently, the membership includes groups from the western United States, Alaska, and New Zealand.
Since much of the performance data on RACS has been compiled by the manufacturers themselves or by researchers collaborating with device manufacturers, the TARP group saw a need for an independent study to evaluate RACS performance and to enable comparisons between systems. A request for proposal was issued in summer 2019 and TARP awarded the contract to Montana State University (MSU) researchers in November 2019.
I served as project lead. I was an Associate Professor in MSU’s Mechanical Engineering department and had worked on projects involving avalanches and snow dynamics for over 20 years. My background in the design, development, and implementation of instrumentation and remote sensing systems aligned well with the needs of the project. Researcher Brandt Seitz became an indispensable team member and used the project as the focus of his mechanical engineering master’s degree research. Professor Daniel Miller from MSU contributed expertise to the project, especially in early planning stages. Invaluable field support was provided by Pete Maleski from the Bridger Bowl ski patrol, David Richards and his Alta ski patrol crew, Damian Jackson and the avalanche control team from the Utah Department of Transportation, Jamie Yount and team from the Colorado Department of Transportation, and members of the Colorado Avalanche Information Center.

MSU RACS PROJECT
The fundamental goal of this effort was to evaluate the blast characteristics from operational RACS and then publish results for use by practitioners. The basic task was to record accurate air pressure measurements of the blast wave, or “overpressures”, for each of several RACS. The data would need to be logged at different distances and in different directions from the RACS shot to allow calculation of the peak pressure, the rate of pressure rise, the energy at a given distance, and the shape and distance of the blast effect.
A thorough review of prior research was conducted first. Foundational snow science work from Atwater, LaChapelle, Gubler, Schweitzer, and others helped to clarify the big picture. The relatively few RACS-specific efforts—especially those documented by Stephan Simioni et. al. at the WSL Institute for Snow and Avalanche Research in Davos, Switzerland—provided some helpful clues on measurement methodology and procedures. Simioni ‘s work on early Gazex system development also provided data useful for comparison with MSU’s project results. However, relatively little documented research was found, confirming the need for our work.
One of the daunting challenges was the environment and location of the RACS, which are invariably placed in steep avalanche starting zones, with typical slope angles from 30–45 degrees. Researchers needed to access many different sites to haul in and place sensitive measurement equipment and conduct testing in safety, while dealing with winter weather, variable snow conditions, high elevations, and other challenges. Most of the RACS in this study were accessed on skis. Since everything needed to perform the tests had to be hauled in a backpack to the sites, efficient equipment selection was critical for success.
Existing computerized data loggers or data acquisition systems were too bulky, too expensive, too power-hungry, or otherwise unsuited for the need. Luckily, recent advances in micro-computer technology allowed the team to create a miniaturized portable radio-controlled data acquisition system (DAQ) to take the pressure measurements. Five identical Raspberry Pi micro-computer-based systems were built to gather high sample-rate pressure data. The DAQ systems were sized to fit in a waterproof Pelican case. Remote control was accomplished using a small custom battery-powered radio communication module, also based on a Raspberry Pi micro-computer, and housed in a 3-D printed case. Ten pressure sensors, essentially high-capacity microphones capable of surviving the pressures of the blast, were designed specifically for the project by Larcor, Inc.
These new DAQ systems allowed the team to accurately record explosive blast pressures at a sample rate of 50,000 per second—fast enough to see precise details as the pressure wave blasted past each of the microphones positioned at various angles and distances around the source.
TESTING
With equipment needs addressed, a phased test plan was developed and approved by the sponsor. Phase 1, validation of the equipment, was accomplished in December 2020 with assistance from Bridger Bowl ski patrol. In that testing sequence, the pressure sensors were set out in an array to record blast effects from elevated two-pound pentolite charges. Phase 1 also included measuring pressures at various heights above the snow surface to establish the six inch (15cm) standard sensor height that was used in subsequent testing. The portable system proved highly effective in this test sequence and was ready for the next phase.
Phase 2 was the crux of the project and involved multiple trips to Utah and Colorado for testing actual Gazex, Wyssen, and O’Bellx exploders, plus a few other tests using different types of explosive charges to simulate exploder performance and Avalanche Guard rounds. With help from the Alta ski patrol and Utah Department of Transportation personnel, most of the Phase 2 testing took place in Little Cottonwood Canyon, Utah. A follow-on set of tests in Colorado was recently completed thanks to great help from the Colorado Department of Transportation and Colorado Avalanche Information Center.
For Phase 3, the team investigated some of the effects of RACS placed near terrain features such as cliffs or gullies. Testing was performed with installed systems and representative explosives to begin to explore how the terrain affects the blast intensity and distribution. Results indicated enhanced directionality of the blast effect due to certain terrain features, but since an infinite number of terrain variations are possible, development of definitive conclusions that could be applied universally to proposed installations are not really possible. A good practice might involve the mapping of blast effect patterns at proposed installation sites to quantify site-specific terrain effects before an actual RACS is installed.
DATA PROCESSING AND PRESENTATION
The final project challenge was to process and present the mountain of results in an understandable, useful format that could be applied to both future research and RACS implementation. Multiple days of testing in Montana, Utah, and Colorado resulted in a lot of data! The team recorded data from two-pound pentolite charges, Wyssen systems using both gel and pentolite charges, two sizes of Gazex systems, O’Bellx operational systems, simulated Avalanche Guard rounds, and other configurations. During each test, about three million discrete data points were collected by each of the 10 pressure sensors. All told, approximately 375 pressure records with about 1.125 billion discrete data points were collected and processed. Completing that processing task was perfect for a graduate student proficient in programming using MATLAB computer code.
The complete record of all data is available in table form for researchers to use, but fortunately many of the project results can be represented graphically. One type of graph created from the data is a plot of the maximum pressure seen by each of several pressure sensors located on a common axis at various distances from the explosion.
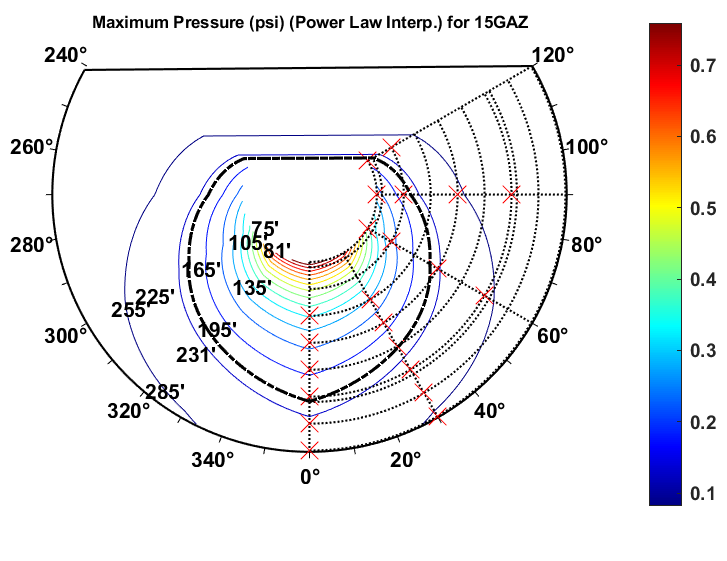
The graph includes a dashed line marking 0.145 PSI, or one kilopascal (KPa.) That pressure value has been proposed by some researchers as the minimum pressure needed to collapse a weak layer, initiate fracture, and induce an avalanche. Importantly, not all agree on this value, and the 1 KPa pressure value is not an absolute indication of effective system range, but identifying the distance where this value occurs provides a standard to compare the relative performance and blast patterns of different RACS.

Pressure decay plots from several angles can be plotted together, with lines of equal pressure added to resemble a topographical map. The resulting ‘map’ of the blast characteristics—as shown in Example 2 —makes intuitive sense. The Gazex mouth aims downhill, resulting in higher pressure downhill of the system than uphill. Intensity of the blast (psi) is indicated by colour. (Different tests had more or fewer data points and testing axes depending on conditions, but this is a representative chart.) Note the thick dashed line at the 1 KPa distance.
The contour plot can also be shown as a 3D volcano plot, as seen in Data Processing Example 3. Colour-coded blast intensity appears as height, mapped against distances from the explosion. Angle orientations are also marked with the 0° axis being straight downhill. This format provides a good visual indication of blast intensity and radial decay.

These three plots showing the relationship of peak pressures to distance and orientation are representative of results that were compiled for every test scenario. Similar plots were created to show pressure rise rates versus location and another set describes energy equivalent versus location for each of the tested systems.
RESULTS AND CONCLUSIONS
The study was designed to provide avalanche control experts with useful information on operational RACS so they could make more informed decisions on using these modern technologies. In general, the project results successfully addressed that need, but it is important to note the results are not all-encompassing, nor do they address every conceivable RACS implementation.
The numerous challenges of field-based research and relying on in-situ testing of actual installations meant only a limited number of installations were examined. Distant test sites necessitated a planned travel schedule for the project team, which meant test day snowpack characteristics and weather conditions were out of the team’s control. And, with any project involving advanced instrumentation and data processing, there are uncertainties present that affect data accuracy. The Seitz master’s thesis addresses some of these issues.
Further, the economics and operational decisions that could drive RACS implementation were outside the scope of the project. It is important to recognize that in certain snowpacks, a localized failure in a weak layer can propagate widely and affect a large area. In that situation, the size of the RACS overpressure zone may be relatively less critical. With those caveats, a few general observations can be made:
Of the systems tested in Phase 2, results indicate the peak pressures, energy equivalents, and pressure rise rates were highest for the pentolite-based explosives (Wyssen, Avalanche Guard), followed by the gel emulsion charge (Wyssen), 1.5 m3 Gazex, 0.8 m3 Gazex, and, lastly, the O’Bellx. Where these parameters are deemed the most important for inducing avalanches, a practitioner could draw some conclusions on system applicability:
- Due to its large charge mass and mostly symmetric blast wave profile, the Wyssen Tower, with either the gel emulsion or pentolite-based charge, affected the largest areas of avalanche terrain. A practitioner might select one of these systems for installation where the downslope, across-slope, and upslope directions are all equally important for avalanche initiation.
- Due to their directionality, individual Gazex systems are perhaps best suited for locations where the potential avalanche starting zones are relatively narrow and elongated downslope of the installation site, and the uphill direction is not seen as an equally likely starting zone. Placing multiple Gazex systems in an array above a broader target area is a common way to expand that area of influence.
- The O’Bellx system, due to its relatively small combustion chamber volume and more limited effective area, might be best used in a relatively small zone where a localized and reliable weak spot or trigger point is known. Phase 3 testing confirmed terrain can meaningfully alter the blast wave effects of an explosive and that current avalanche control practices making use of unique terrain features have merit. For example, data from a simulated Wyssen pentolite test shot detonated on a bamboo pole in a gully feature showed that pressure rise rates directly down the gully (the 0° axis) were approximately double those recorded in flat field testing with the same explosive. However, relatively lower peak pressures and pressure rise rates were observed in a lateral direction (on the 45° axis). This showed that the gully terrain feature increased the directionality of the blast.
A simulated Wyssen pentolite shot detonated on a bamboo pole near a cliff displayed a slight increase in both peak pressure and energy equivalent directly downslope of the blast (along the 0° axis) when compared to flat field testing. As with the gully test, the pressure and energy equivalent values measured on the 45° axis and at 90° to the blast were relatively lower than those measured in a flat field situation. The cliff clearly enhanced the downslope directionality of the blast.
As stated earlier, however, the terrain effect portion of this study was necessarily limited to a few cases. More thorough investigations at individual sites are needed to flesh out the Phase 3 results.

The general results of this study have already been shared in numerous ways, including presentations at the Utah and Colorado avalanche workshops, meetings with device manufacturers, and communications with researchers and practitioners in the U.S., Canada, and Europe. Much of the project is well-documented in the master’s thesis compiled by Brandt Seitz, now available through the Montana State University library . The final report was provided to the TARP team in June 2022, and equipment has already been passed along to TARP to enable additional testing.
The information gleaned will benefit avalanche control practitioners and others in understanding the capabilities, limitations, and possibilities for implementing these interesting devices


