Scoring snow pits for better communication of stability assessments
By Dave Richards1, Karl Birkeland2,3, Doug Chabot4, Jim Earl5
1 Avalanche Program, Alta Ski Area, 2 Birkeland Snow and Avalanche Scientific, 3 USDA Forest Service National Avalanche Center, 4 Gallatin National Forest Avalanche Center, 5 SnowPilot.org

INTRODUCTION
Snow pits can often leave practitioners in a quandary—there just isn’t a succinct and efficient method to communicate findings to one’s peers. This makes it challenging to relate relevant snow pit information to new riders, students, ski patrollers, and even one’s most experienced coworkers. Though we may understand snow pit data and what it tells us about the snow stability, communicating those findings quickly and succinctly is problematic. Our proposed method aims to simplify and improve communicating the most relevant data. As a caveat, our scoring system applies only to dry slab avalanche conditions.
Though some practitioners previously viewed snow pits solely as a forecasting tool, the advent of newer testing methods has given us improved stability assessments and allows pits to be used as a now-casting tool. Sharaf and McCammon (2005) first looked at snow pit information through the lens of “strength, structure and energy,” rating each factor as good, fair, or poor. Many practitioners continue to use this method, and it is now taught in the Level 1 curriculum; though “propagation propensity” has replaced “energy,” since propagation can be indexed with modern stability tests while energy has a clear physical meaning that is not captured in a typical snow pit (Fig. 1).
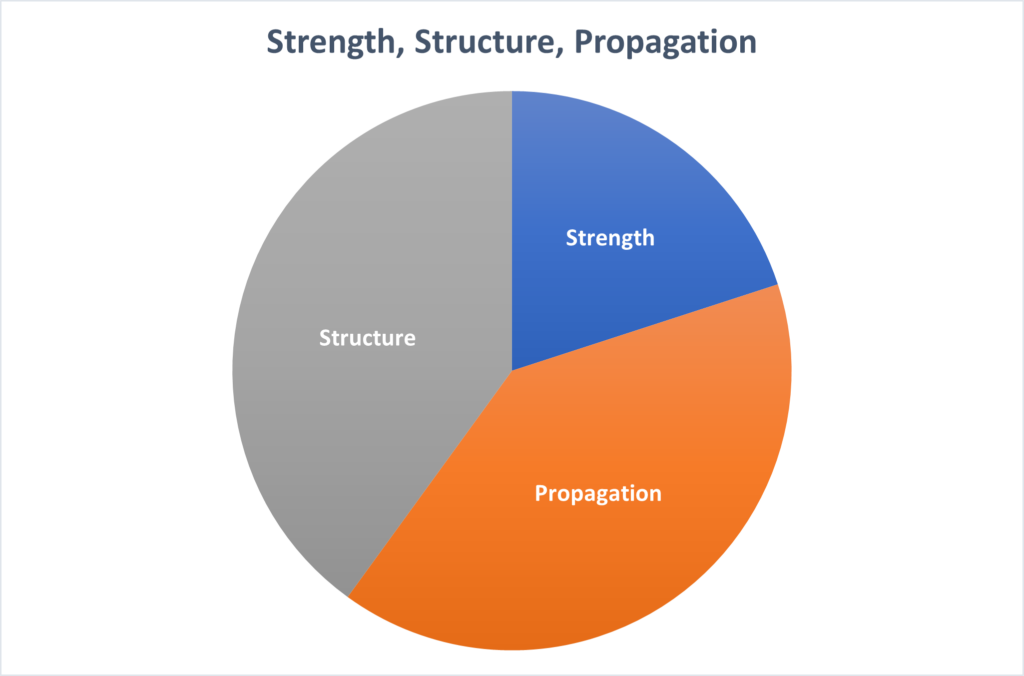
We prefer the nomenclature of strength, structure and propagation—three things everyone can see and interpret, and that require only a hand, a shovel, and an extended column test (ECT) cord to measure. Further, these three factors can easily be given a score. The sum of these
scores can allow us to communicate snow pit findings in comparison to overall stability. This is preferable to saying, “So what?” or “Looks good to me.”
METHODS
Scoring pits
Researchers have assessed the utility of stability tests using methods that rate slopes as either stable or unstable (e.g., Simenhois and Birkeland, 2009). However, the shortcoming of these techniques is that stability is not strictly binary. Techel et al. (2020) developed a more nuanced approach based solely on observed signs of instability and used that to better identify how well specific tests assessed stability.
Our proposed snow pit scoring technique, dubbed the Grom Score, sums up numerical scores for strength, structure, and propagation propensity (Fig. 2). Propagation propensity is scored using ECT results, strength is scored with the number of ECT taps, and structure is assessed by a simplified version of the five lemons (McCammon, and Schwiezer; 2002) called the PHD factors (persistent weak layer/hardness change/depth of the weak layer) of snowpack structure.
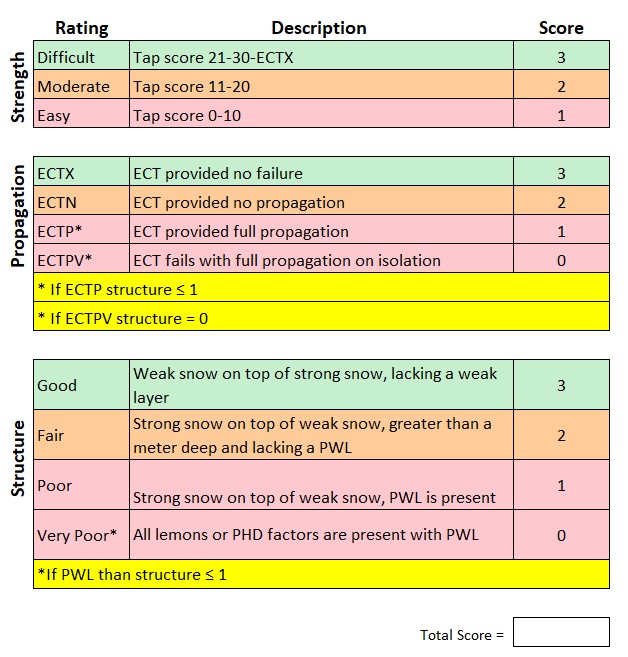
We feel any scoring system should emphasize structure and propagation more heavily than strength, which can vary dramatically over short distances. In our scoring system, we give additional weight to structure and propagation by scoring them on a scale of 0–3 rather than the 1–3 scale we use for strength, and by applying the following three rules:
- If a PWL exists, then structure score ≤ 1
- If ECTP, then structure ≤ 1
- If ECTPV, then structure score = 0
In our method, structure is scored using the three simple PHD factors. Is there a persistent weak layer (PWL)? Is there a hand hardness change of one step or greater? Finally, is the depth of the weak layer less than one metre? The PHD factors are the simplest method of scoring snowpack structure and are often taught in modern Level 1 curricula.
Discussions with many avalanche professionals about our proposed scoring system raised several questions and arguments. First, should propagation and structure be weighed more heavily than crack initiation? This is a valid criticism, because if a crack cannot be initiated, then there is no avalanche. However, while crack initiation with the ECT is difficult when a weak layer is deeply buried, that same weak layer may be buried more shallowly at other locations on that slope due to spatial variability.
Second, several studies note ECT propagation alone cannot perfectly discriminate between stable and unstable slopes (Simenhois and Birkeland, 2006; Moner et al., 2008; Simenhois and Birkeland, 2009; Winkler and Schwiezer, 2009; Techel et al., 2020). While this is true, research also shows propagating ECT results are more often associated with unstable conditions (Techel et al., 2020). Therefore, when propagation in an ECT is present, our scoring method weighs it heavily. Finally, some people argued structure trumps all. We agree this is true when the weak layer is deeply buried, which is why our method scores the structure of any snowpack with a PWL as less than or equal to one.
At first glance, our method appears to score snow pits with more stable snow higher than those with less stable findings. For example, a 150 cm deep pit with a faceted weak layer at 90 cm and an ECTP 17 at that weak layer would score a four. This clearly indicates a situation with low stability. Another pit on a nearby slope might have the same faceted layer at the same depth, but with an ECTN 25. This improves our score to six, which is better but still not great. Finally, in a third pit we do not find the facets, but there is a non-persistent weakness 130 cm down where we get an ECTN 23. Our score for this pit is a seven, which is a slight improvement. Thus, in general terms, the higher a pit scores, the better things seem to look. However, we wanted to more rigorously test the effectiveness of our scoring system.
Testing the Grom Score
To assess whether or not our scoring system differentiated between stable and unstable profiles, we used the SnowPilot database (Chabot et al., 2004; Snowpilot.org). We only included pits where an ECT score was reported and the user gave the slope a stability rating.
First, we manually scored 100 snow pits randomly drawn from the database without prejudice to date or international location. Since these initial results were encouraging, we automated the scoring procedure, applied it to over 3,000 pits in the SnowPilot database, and graphed our results.
RESULTS AND DISCUSSION
Our analysis of 3,393 pits in the SnowPilot dataset showed promising relationships between user’s stability assessments and numerical scores from our proposed method (Fig 3). With each increase in the Grom Score from three to nine, the proportion of pits that users rated as “good” increased, while the proportion of pits rated as “poor” declined. This also holds generally for pits scoring a one or two, but the number of pits in those categories were small, so those results should be interpreted cautiously.
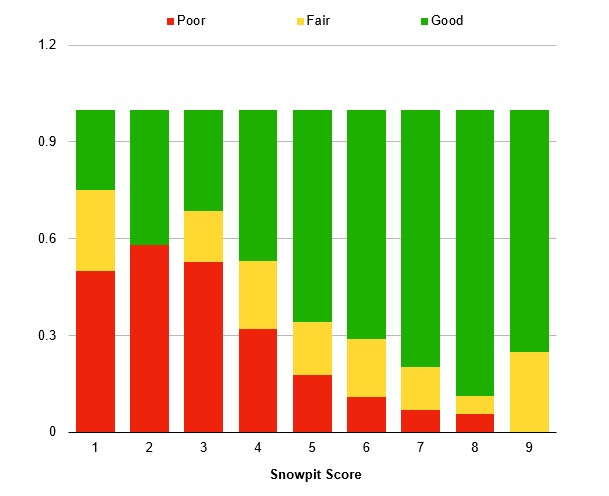
A critically important takeaway from our results is the variability in stability assessments associated with each pit score. For example, even though most of the pits with a score of three are rated “poor,” about 30% of them are rated “good.” At the other end of the scale, although about 90% of the pits scoring an eight are rated “good,” that still means about 10% of the pits are associated with stability ratings of “poor” or “fair.” We also noted our scoring system is relatively conservative, with more of a tendency to give a stable pit a low score (i.e., 30% of the pits with a score of three are rated “good”) than to give an unstable pit a high score (i.e., only about 5% of the pits with a score of 8 are rated “poor” and no pits with a score of 9 are rated “poor”) (Fig. 3). This is a desirable characteristic since it encourages conservative decision-making.
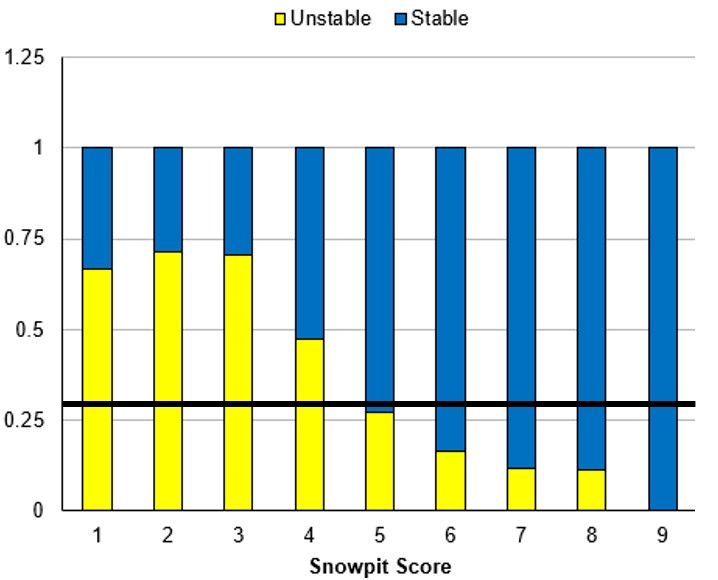
In a further analysis, 6,670 snowpits were sorted into categories of stable (N=4,472) and unstable (N=2,198) based on the parameters of Techel et. al (2020). This gave a ‘base unstable rate’ of .33 (Fig. 4). The Grom Score for snow pits aligned well with the Techel stability observations. At scores of four or less, the number of pits rated unstable exceeded our base rate; at scores of six or more, the unstable pits were less than the base rate; and at a score of five, the number of pits rated unstable was roughly equal to our base rate. This gives us additional confidence that pits with lower scores are more likely to be associated with truly unstable snow, while pits with higher scores are more likely to be associated with stable snowpacks.
Some of the variability in our results may be explainable. We noted a few cases where pits with low scores that users rated as having “good” stability had unstable stability test results but relatively shallowly buried weak layers. However, other variations may be more challenging to
explain. Ultimately, any pit scoring system—including ours—oversimplifies the more nuanced data contained in a complete snow profile. Thus, we strongly discourage using our pit scores to replace the important work of closely examining all the information contained in a profile. Instead, our method supplements the detailed information in snow pits by allowing avalanche professionals to quickly
communicate general information to other professionals or the public.
CONCLUSIONS
The main goal of this work was to develop a method to quickly communicate snow pit information. The Grom Score can be easily communicated within an organization, to other avalanche professionals, and to the lay backcountry skier. While the Grom Score does not take the place of all the nuanced data contained in a snow pit, it does provide a quick and simple snapshot of stability based on snow pit information.
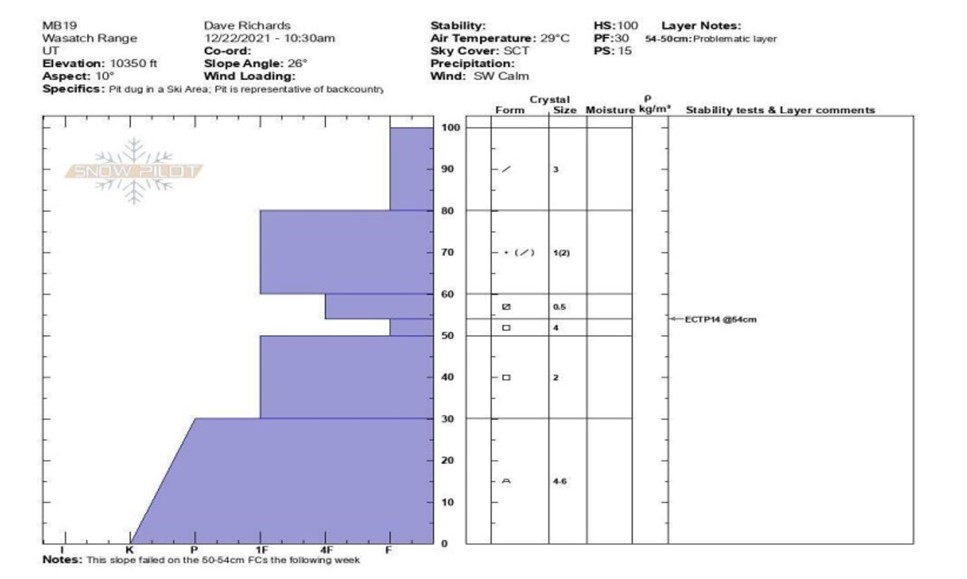
These scores can help untrained recreational users better understand pit results. Professionals can glean a great deal of useful information from a snow pit graph (see Fig. 5), but these plots may confuse untrained backcountry skiers. Using the Grom Score, we can communicate that this real-world pit scores a three and has poor stability. This pit scored zero for structure based on the presence of a PWL, depth, and a
hardness change. It scored one for propagation with an ECTP, and two for strength with a tap of 14. The slope avalanched later in the week this observation was made.
Because the scoring method improves communication clarity, it may facilitate group decision-making. When we rate stability from very poor to very good, the words can be misconstrued and misunderstood. However, a numerical score is more easily understood and communicated. During the 2022-23 winter, the Grom Score was successfully used as a decision-making tool by numerous educators from both the University of Utah and the American Avalanche Institute.
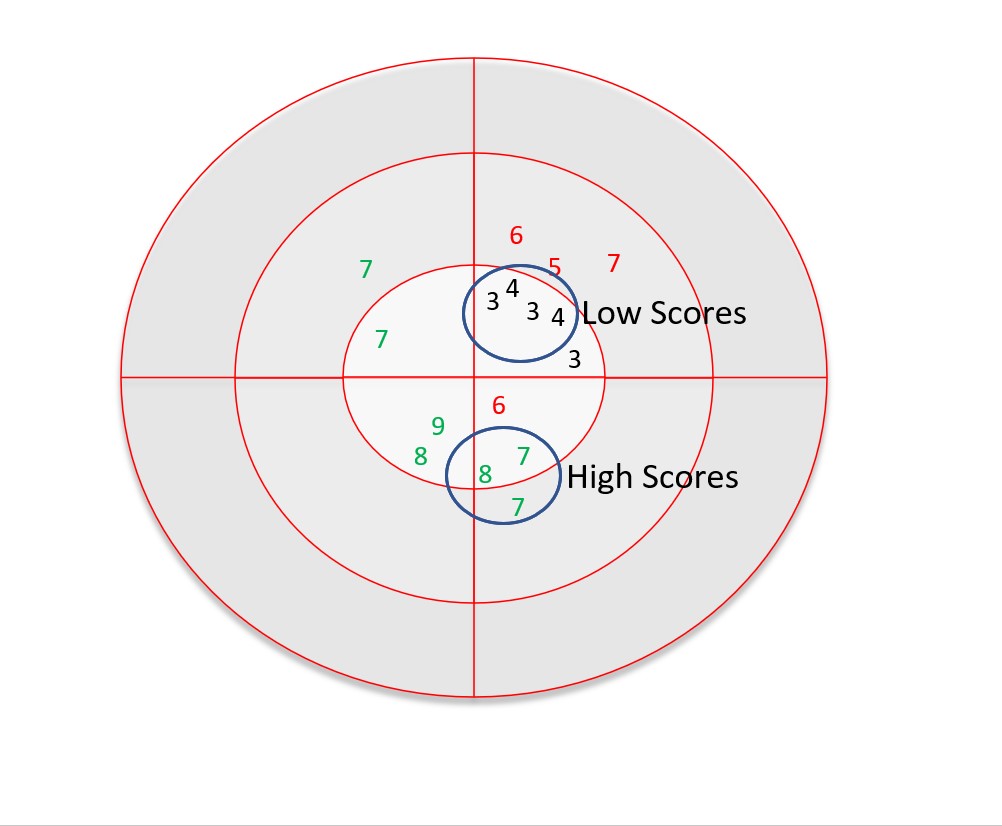
One especially useful way to use pit scores is to map them on an aspect/elevation diagram (Fig. 6). These graphs allow professionals and the public to condense all of the information contained in many snow pits into a simple, digestible diagram identifying current stability patterns. Using several of these diagrams over the course of a season provides a visual representation of changes in stability patterns. Avalanche educators and some heli-ski operations found this approach worked well during the 2022-23 winter.
Summary
Avalanche professionals have discussed scoring snowpits for many years. Our method is a simple first step and a way to start the conversation with other professionals and researchers. That said, the initial feedback from a number of avalanche professionals is this first step is a worthwhile effort toward improving the standardization and communication of pit results.
Analysis of a large database of thousands of snowpits dug worldwide show the Grom Score correlates reasonably well with the stability assessments of avalanche practitioners. Anecdotal evidence leads us to believe that a numerical score may be a better method of communication than our typical stability ratings.
For this study we only used ECT results; however, some users do not apply this test. Perhaps a future iteration of our pit scoring method could utilize other stability tests such as propagation saw tests.
Avalanche professionals work in an environment of increasingly complex data, with even more complicated language to explain those data. We can simplify things by providing a snapshot of instability through our scoring method. Avalanche educator and helicopter ski guide Jim Conway summed things up when he told us: “The pit scoring system is simple to digest and use, and more importantly, it allows quick concise communications in the field environment. The system still allows for more detailed traditional pit evaluation data to be shared when this is needed.”
ACKNOWLEDGMENTS
The authors thank the following people for their invaluable contributions to this paper: Lynne Wolfe, Gabrielle Antonioli, Greg Gagne, Mark Staples, Drew Hardesty, Trent Meisenhiemer, John Tuckman, Liam Fitzgerald, Jonathan Morgan, Pete Groves, Jake Hutchinson, Jim Conway, and the staff of the Alta Ski Patrol.
REFERENCES
Chabot, D., M. Kahrl, K.W. Birkeland, and C. Anker. 2004. SnowPilot: A new school tool for collecting, graphing, and databasing snowpit and avalanche occurrence data with a PDA. Proceedings of the 2004 International Snow Science Workshop, Jackson Hole, Wyoming.
Moner, I., Gavaldà, J., Bacardit, M., Garcia, C., Mart, G. 2008. Application of Field Stability Evaluation Methods to the Snow Conditions of the Eastern Pyrenees. Proceedings of the 2008 International Snow Science Workshop, Whistler, British Columbia.
McCammon, I. and J. Schweizer. 2002. A field method for identifying structural weaknesses in the snowpack. Proceedings of the 2002 International Snow Science Workshop, Penticton, British Columbia.
Sharaf, D., and I.McCammon. 2005. Integrating Strength, Energy, and Structure into Stability Decisions, The Avalanche Review 23(3).
Simenhois, R. and K.W. Birkeland. 2006. The extended column test: A field test for fracture initiation and Propagation. Proceedings of the 2006 International Snow Science Workshop, Telluride, Colorado.
Simenhois, R. and K.W. Birkeland. 2009. The Extended Column Test: Test effectiveness, spatial variability, and comparison with the Propagation Saw Test. Cold Regions Science and Technology 59(2-3), 210-216.
Techel, F., K. Winkler, M. Walcher, A. van Herwijnen, and J. Schweizer. 2020. On snow stability interpretation of extended column test results, Nat. Hazards Earth Syst. Sci. 20, 1941–1953.