Operational Remote Sensing of Avalanche Activity Using Satellites
By Markus Eckerstorfer, NORCE – Norwegian Research Centre AS, Bergen, Norway
This article initially appeared in The Avalanche Journal, Volume 125, Winter 2020
Detecting avalanche activity is critically important for avalanche forecasting. In Norway, they have begun using satellites to do this task.
THE PROBLEM: ‘How many avalanches, and of what size, have recently been released in our forecast domain?’ This seemingly simple question is very difficult to answer for a typical forecasting region. Although avalanche activity information is critically important for generating reliable avalanche forecasts, such data are rarely available at the spatio-temporal scales relevant for an entire forecasting region [1]. Avalanche forecasters must therefore deal with spatio-temporal scaling issues, where data from short time frames across non-representative areas is all that is available. The forecast then relies on incomplete data from a convenient spatial sample—data that is easily observed within the forecast domain.
OVERVIEW OF SOLUTIONS
Over the past decade, innovative technologies have been introduced, tested, and operationalized to assist in solving the sampling and scale deficiencies in avalanche observations. A combination of different remote sensing platforms and sensors are used to monitor avalanche activity across a range of spatial domains spanning single slopes to entire forecasting regions, either through continuous monitoring or during monitoring campaigns.
We classify remote sensing platforms into ground-based, airborne, and spaceborne. Sensors on these platforms are classified into optical, radar, or acoustic. In general, there are tradeoffs between the temporal and spatial resolution of any remote sensing technique, thus the choice to employ a certain remote sensing technique ideally depends on best matching the system and sensor to the monitoring problem at hand [2].
Monitoring avalanche activity on a slope to valley scale has been successfully demonstrated using automatic lapse cameras [3], lidar (light detection and ranging) scanners [4], infrasound [5] and terrestrial radars [6]. These remote sensing solutions are beneficial by allowing for
continuous, real-time monitoring of small avalanches in a range of weather or light conditions (depending on the sensor, with the exception of time lapse cameras). Some of these remote sensing techniques have been successfully operationalized and are employed for real-time avalanche monitoring in areas with critical infrastructure, such as the infrasound and long-range radar avalanche detection system in Rogers Pass.
However, both equipment and operational costs are high for these, ground-based monitoring systems. These costs must be weighed, for example, against investing in permanent mitigation measures.
In recent years, the use of drones has increased our ability to monitor avalanche activity during dedicated field campaigns and we currently see different sensors being deployed on these airborne platforms [7]. The technology for monitoring broader spatial domains such as an entire forecasting region is still at a lower level of readiness. The main reasons include low data acquisition frequencies (often several days), high financial costs (several thousand dollars for very high resolution optical satellite imagery), limitations in detecting small avalanches due to poor sensor resolutions, and the complexity of automatically detecting avalanches in satellite imagery.
AUTOMATIC AVALANCHE DETECTION IN SENTINEL-1 IMAGES
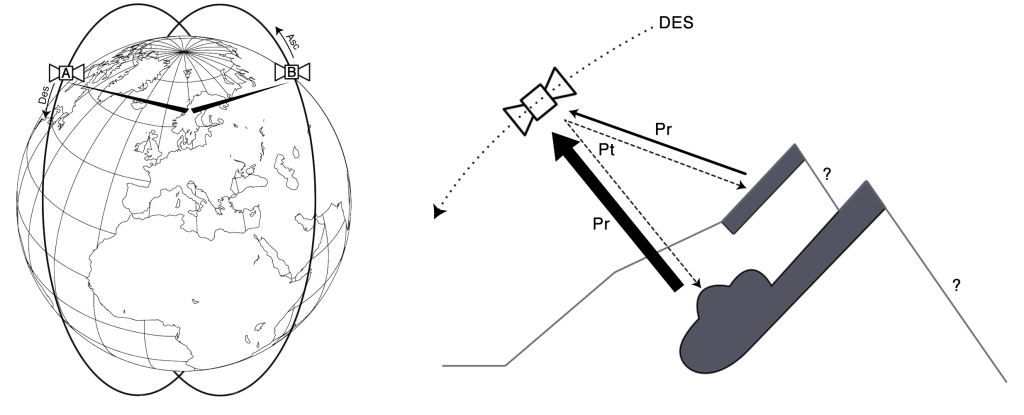
A handful of studies published in recent years have shown the two Sentinel-1 radar satellites to be the workhorses for regional to country-wide avalanche monitoring [8], [9]. The satellites are part of the European Commission’s Copernicus environmental monitoring program, which offers freely available, global earth observation data. They are equipped with synthetic aperture radar (SAR) sensors that produce radar images with a pixel resolution of 20 metres. SAR sensors have all-weather, all-light monitoring capabilities; however, due to their side-looking geometry, radar shadow and layover effects occur on particular slope aspects.
The SAR sensors on board the Sentinel-1 emit electromagnetic radiation in C-band radar frequencies. C-band SAR is generally ineffective in detecting dry snow, however, it is reflected to a very large degree at the surface of wet snow. C-band SAR can thus successfully be used to distinguish dry from wet snow, and for determining snow water equivalent. The energy reflected back to the sensor is called backscatter.
NORWAY’S OPERATIONAL AVALANCHE MONITORING SYSTEM USING SENTINEL-1
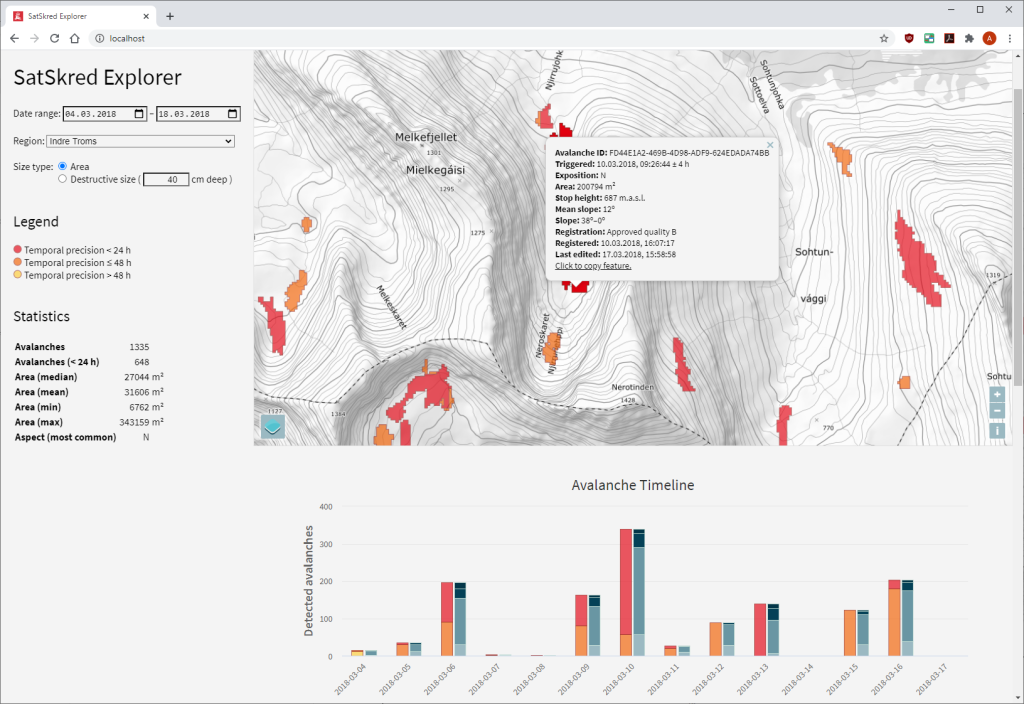
Over the past five years, we have developed the most technologically mature automatic avalanche detection system for large scale monitoring using Sentinel-1. Norway is particularly suited for using Sentinel-1 data due to the country’s high latitude, which ensures daily data coverage across the majority of the country. In addition, similar to Canada, avalanche forecasting regions are large and thus difficult to monitor consistently in space and time. In the Satskred (“skred” means avalanche in Norwegian) project, we worked with the Norwegian forecasting service (varsom.no) within the Norwegian Water and Energy Resource Directorate and the Norwegian Public Road Administration to develop the operational monitoring system.
A fully automatic processing system constantly downloads all available Sentinel-1 images over Norway and detects avalanches in these images by comparing them to images from the same location during the previous pass six days prior. If an avalanche occurred within these six days, our automatic detector identifies an increase in energy reflected back to the sensor from the debris field of the avalanche. As other natural phenomena can also exhibit temporal backscatter increase, we deploy our automatic detector only to predefined avalanche runout areas to increase the odds that the backscatter increase we are detecting is related to avalanche activity.
The initial temporal uncertainty of six days is then iteratively minimized by detecting the same avalanche in subsequent Sentinel-1 images and tracking its age. Wet snow avalanches exhibit a stronger backscatter increase and therefore also exhibit a stronger contrast to undisturbed snow. Our automatic detector performs significantly better for wet snow avalanches, with a probability of detection of around 75%, than for dry snow avalanches, where the probability of detection is around 20%, when we compare our detections to manual avalanche field observations. Moreover, the 20 metre spatial resolution of the SAR sensor sets the lower limit of detectable avalanches to destructive size two.
Overall, given the constraints in detectable avalanche size as well the problems with detecting dry snow avalanches, we assume we are under-detecting. To deal with the uncertainty that stems from the varying probabilities of detecting certain types of avalanches, the final output of the processing system is summarized to regional averages for each forecasting region. The avalanche forecasters receive daily updated information on the presence and location of avalanche detections and have the possibility to visually check detections presented as vector polygons on a web-based map solution.
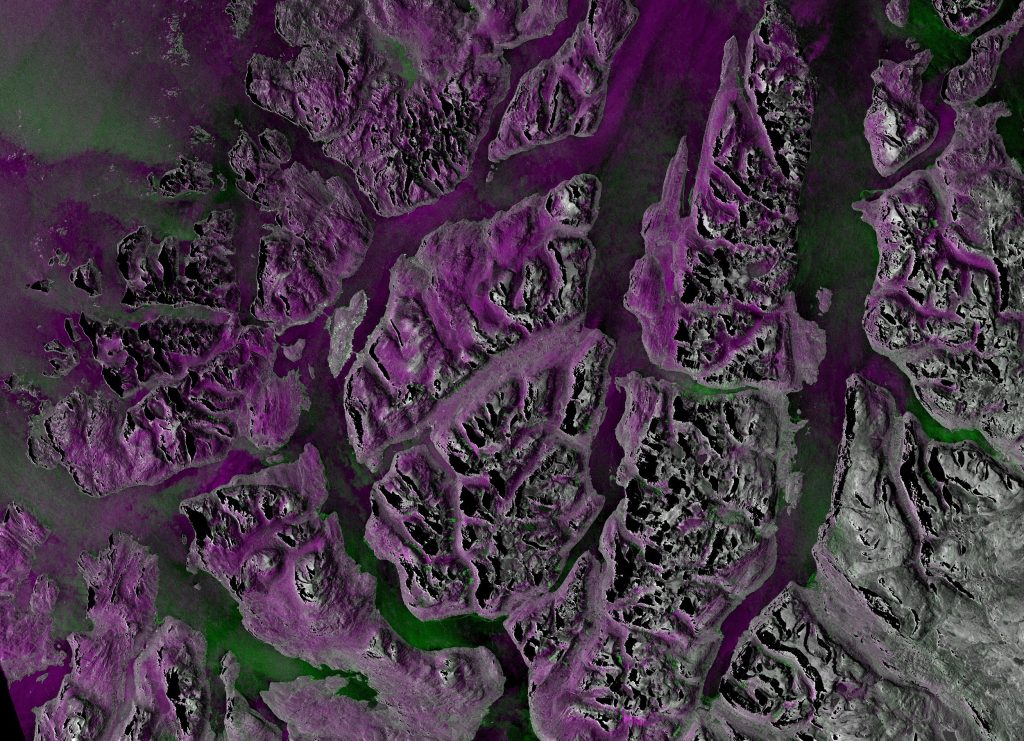
For the upcoming winter, the Norwegian avalanche forecasting service will run the processing system on their servers, detecting avalanches
in all 22 forecasting regions on a daily basis to assist in reducing uncertainty in their avalanche forecasts.
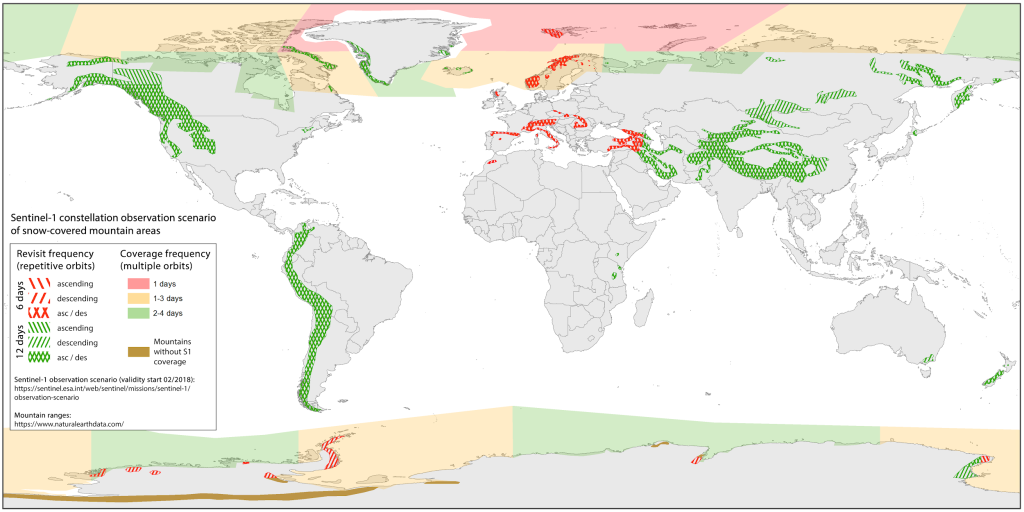
Global application of Norway’s avalanche detection system The Sentinel-1 satellites cover all snow-covered mountain regions worldwide, with the exception of the Transantarctic Mountains. Due to the generic nature of our avalanche detection system, it is feasible to establish consistent, automatic avalanche detection anywhere on Earth. As input data, a high resolution digital elevation model (20 m) and an avalanche runout area mask are required. The latter can now be automatically generated using a recently devised method to automatically derive Avalanche Terrain Exposure Scale Maps [10].
The largest limitation for applying our detection system anywhere on Earth is the availability of Sentinel-1 images and their revisit frequency. The standard revisit frequency for images with similar geometry and tracks is six days in Europe and over seismic hotspots, and 12 days elsewhere. However, since there are two Sentinel-1 satellites travelling 180 degrees apart in polar orbits, satellite tracks overlap, especially at high latitudes, effectively reducing revisit frequencies. For Rogers Pass, for example, during a 12-day repeat cycle, images are acquired on day one (ASC), day three (ASC), day four (DES), and day nine (DES). An equal number of ascending (from the North Pole, looking left) and descending geometry images (looking right) are thus required to detect avalanches on all slope aspects. However, the acquisition timing is inconsistent, with a five-day data gap between the images at day four and day nine, as well as a three-day data gap between day nine and the start of the subsequent 12-day cycle.
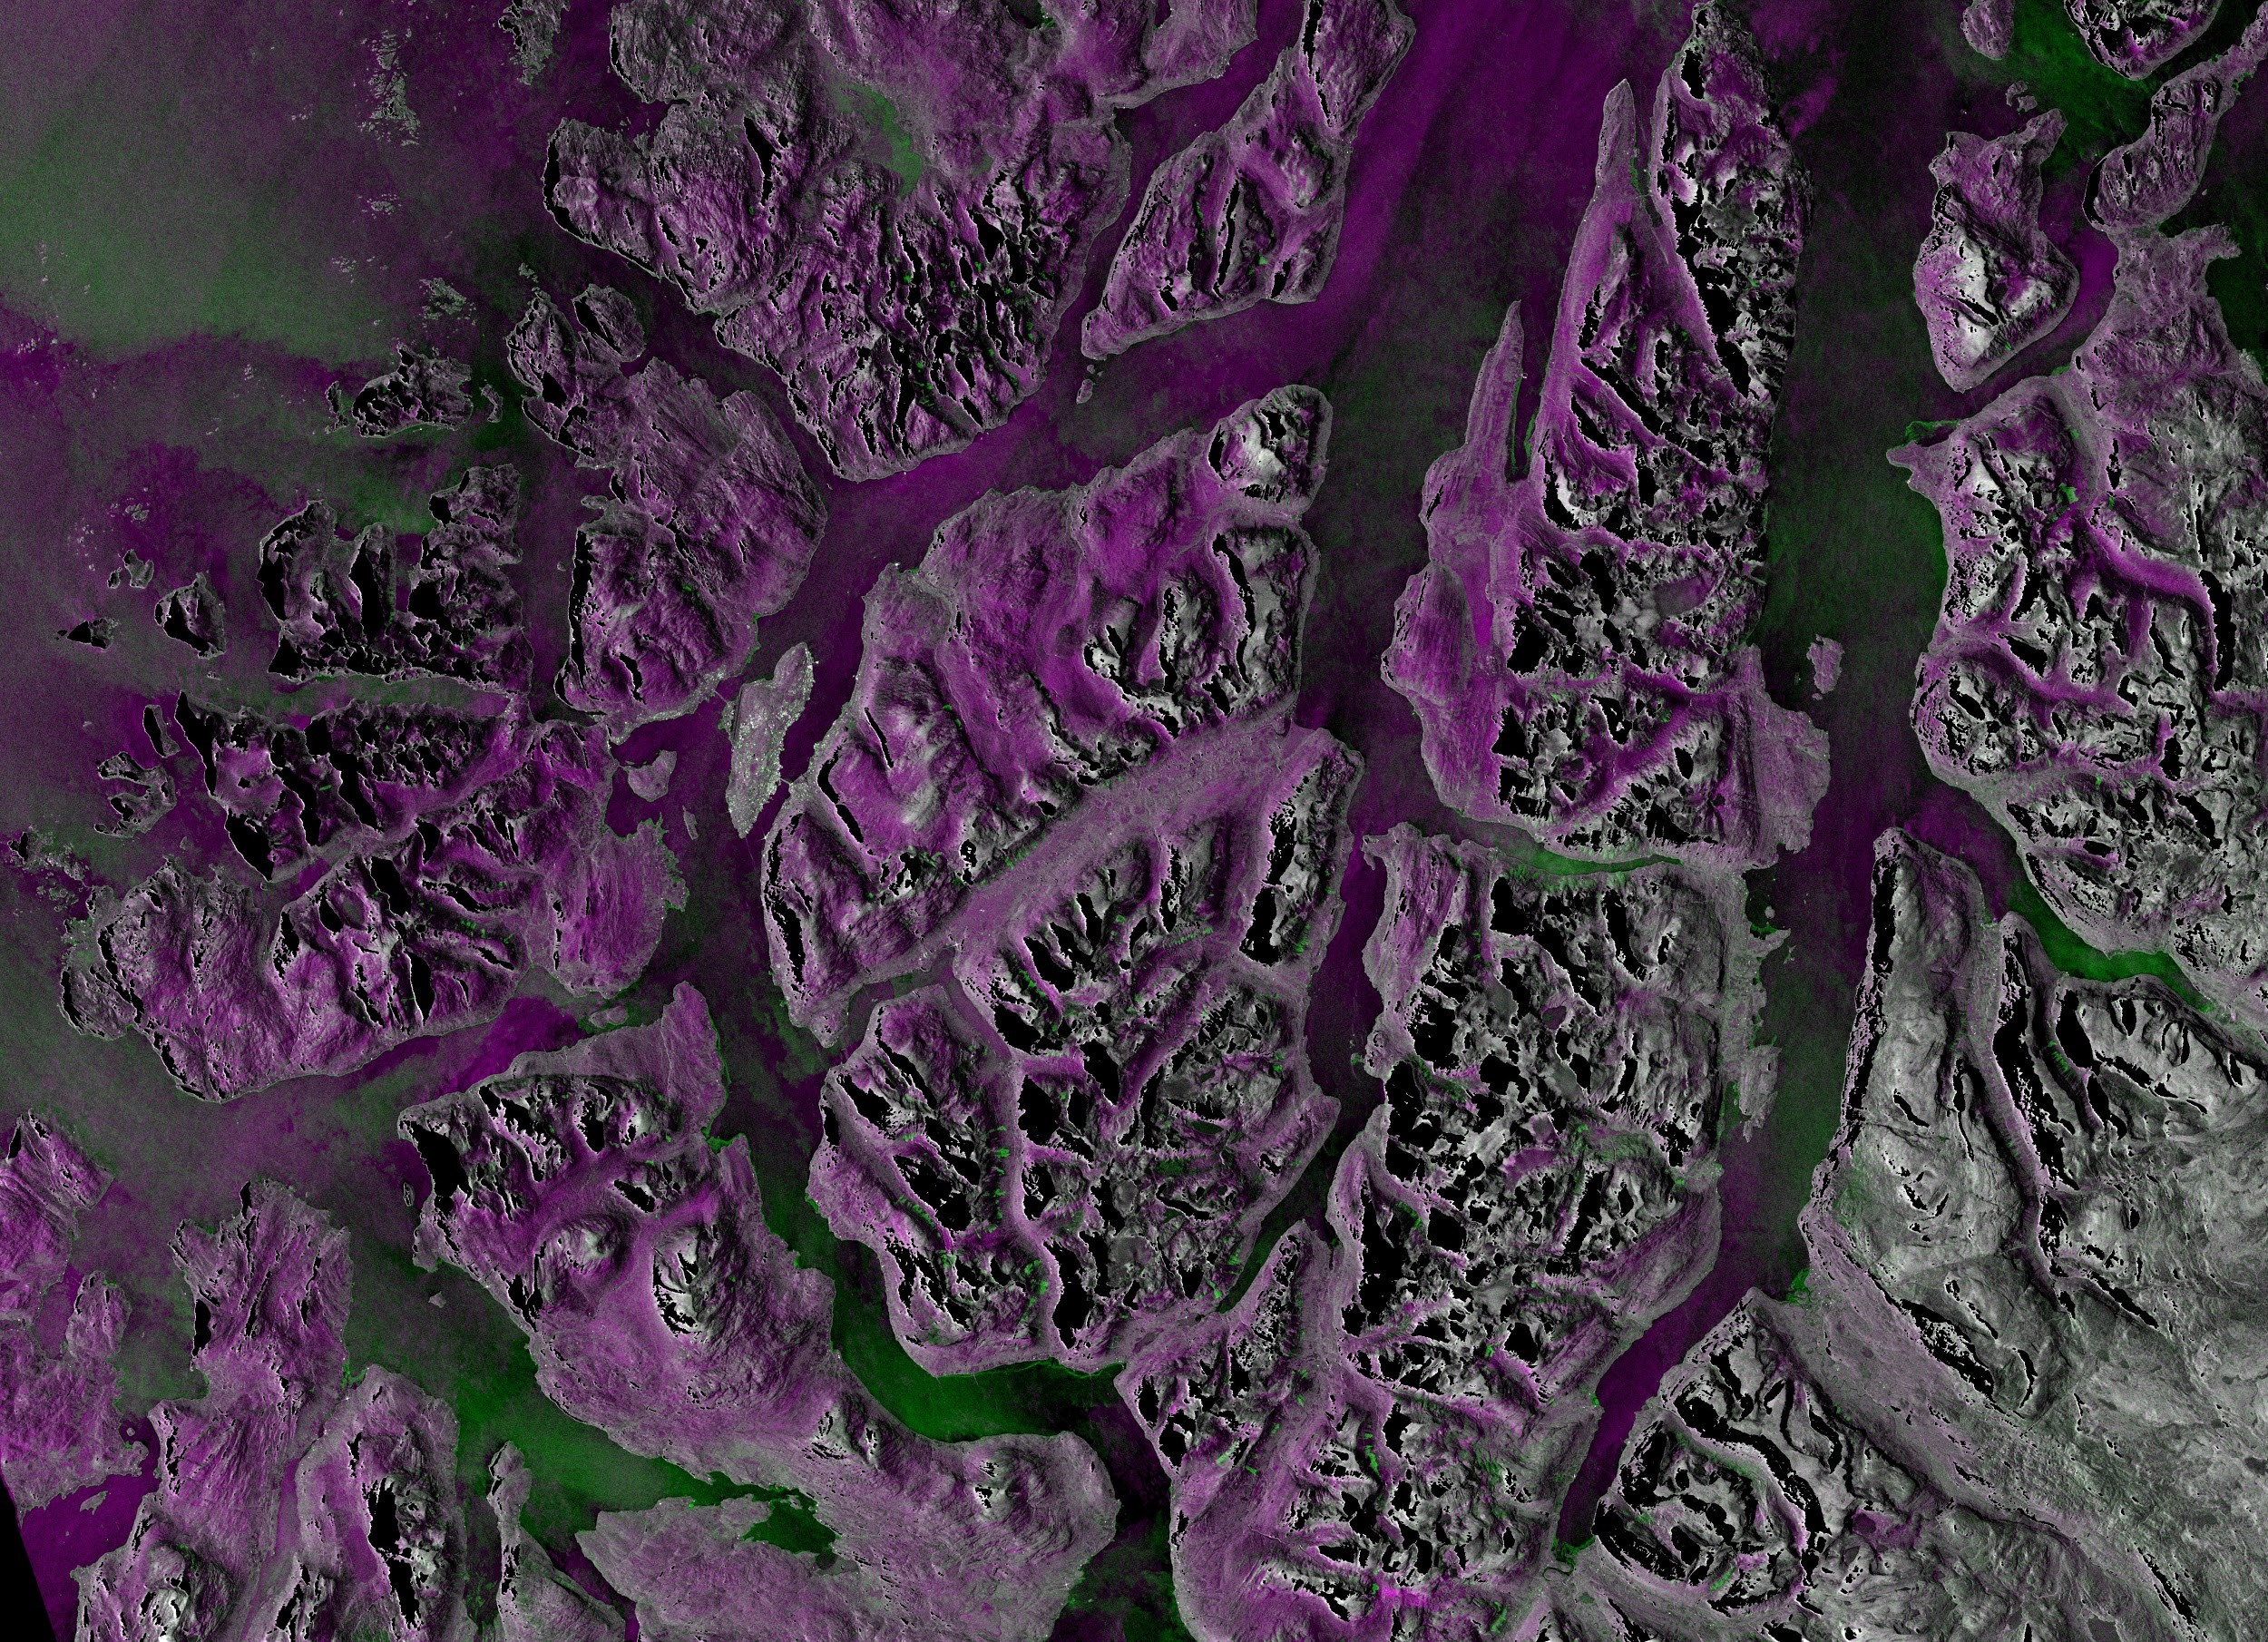
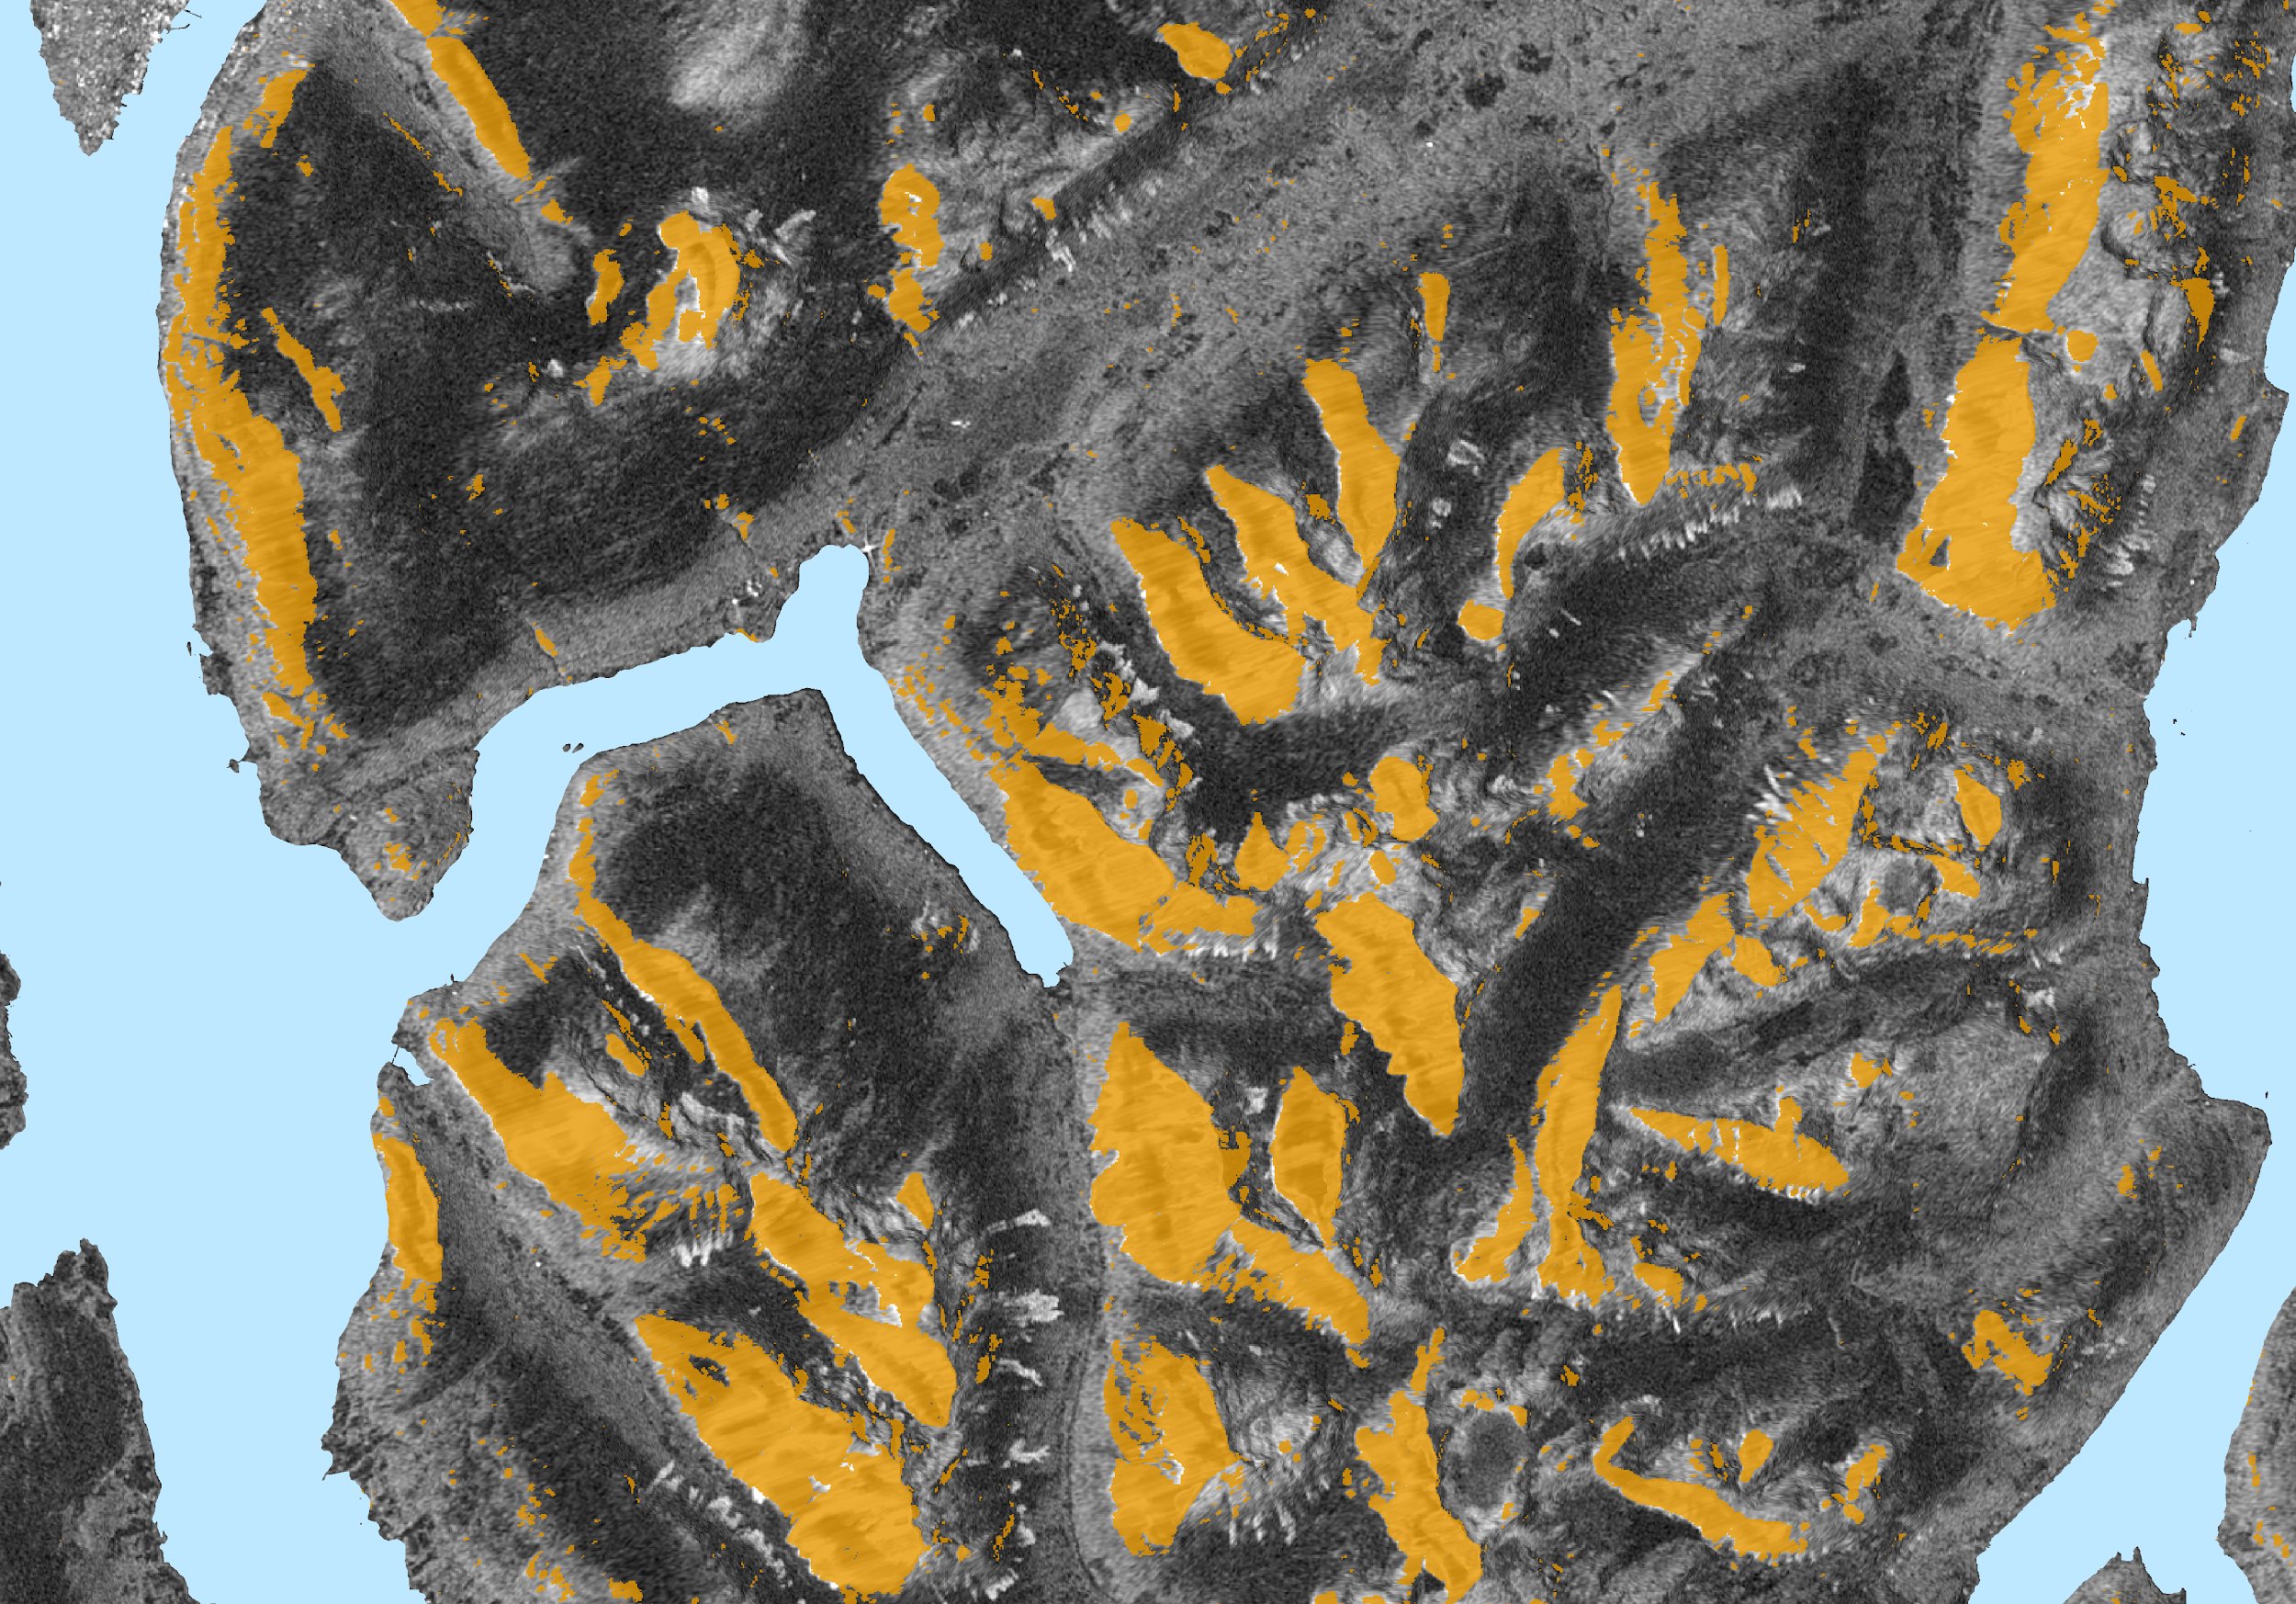
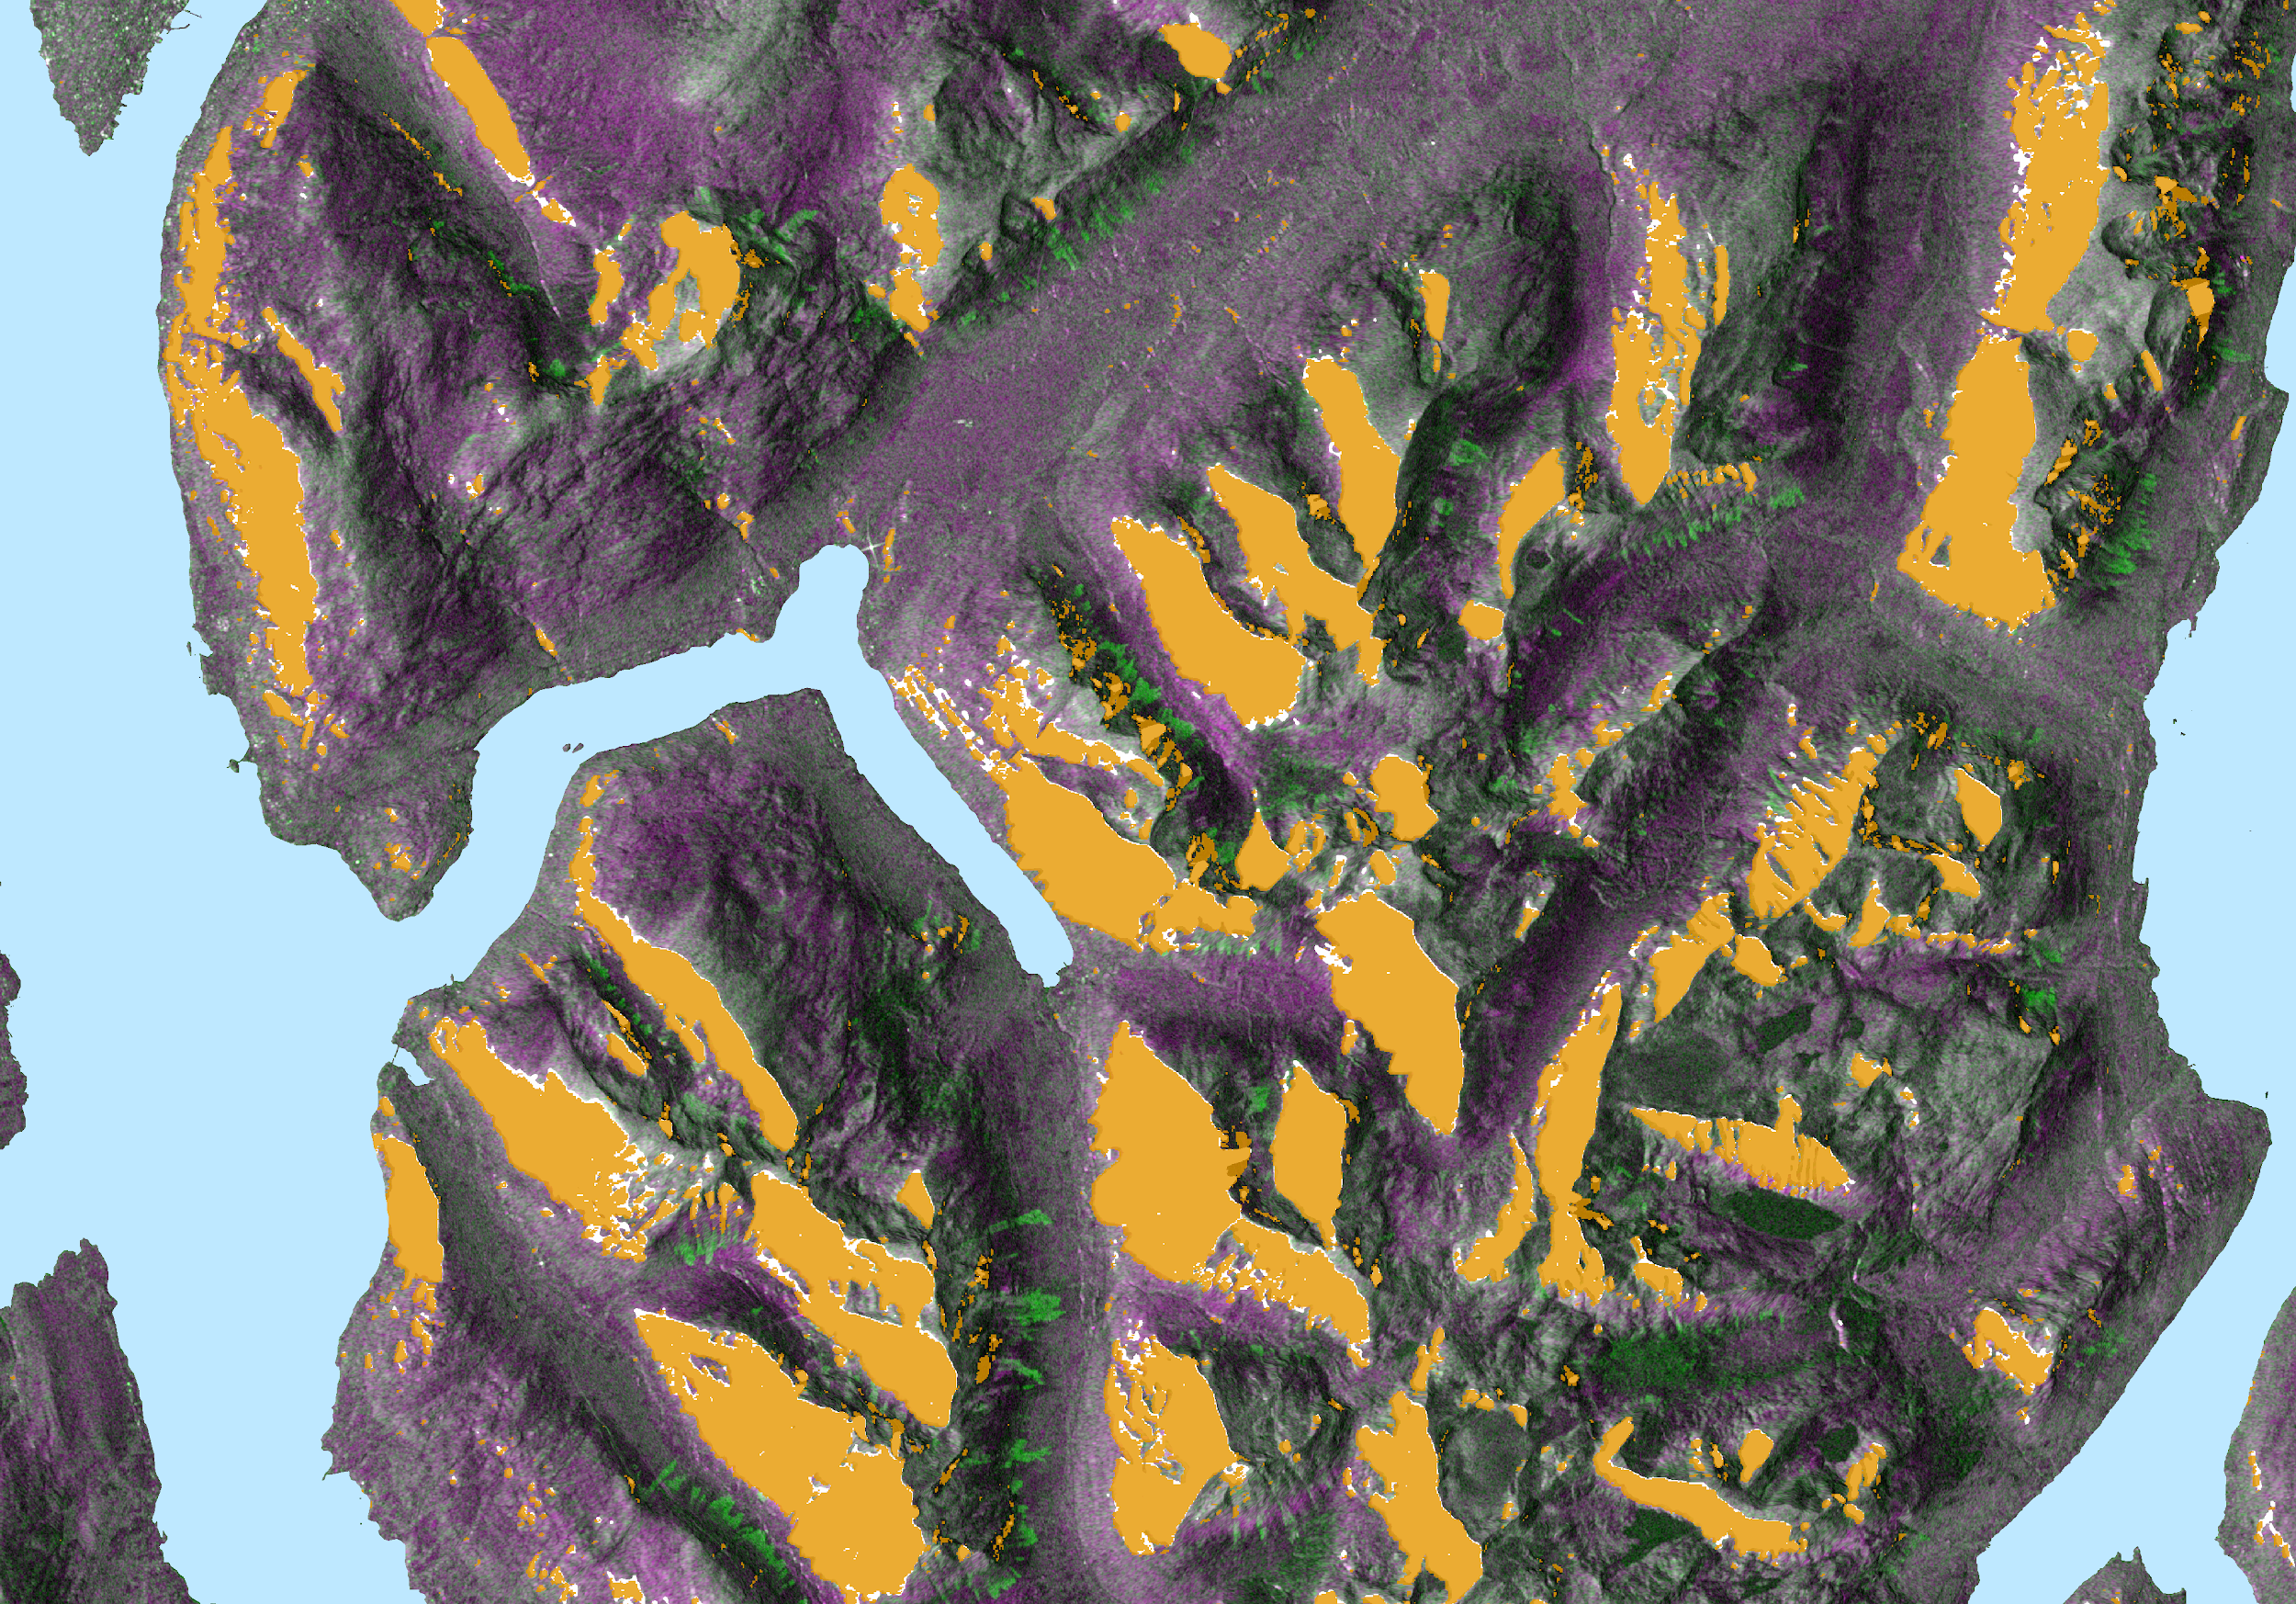
FIG. 5: THE THREE PANELS SHOW THE LOGIC BEHIND THE TEMPORAL CHANGE DETECTION USED TO DETECT AVALANCHES IN SENTINEL-1 IMAGES (THE ORANGE AREAS ARE IN THE RADAR SHADOW). IN THE IMAGE FROM DAY ONE (LEFT), NO AVALANCHE ACTIVITY IS VISIBLE, WHILE THE IMAGE FROM DAY SIX (MIDDLE) CONTAINS SEVERAL DOZENS OF AVALANCHES, VISIBLE AS ELONGATED, LIGHT GREY FEATURES EXTENDING FROM THE MOUNTAIN SLOPES. THE RGB CHANGE DETECTION IMAGE (RIGHT) SHOWS THE AVALANCHES IN GREEN FOR BETTER VISUAL INTERPRETATION.
THE ‘ORBIT’ AHEAD
During next year’s ISSW in Fernie, we hope to report from a successful first winter of Norway-wide avalanche detections using Sentinel-1 and share our experiences with the broader avalanche community. We are currently working on gaining a better understanding of the radar backscatter signal from avalanche debris—especially from dry snow avalanches—in order to improve detection performance. The latest development is to exchange our current automatic avalanche detection algorithm with a neural network, with initial tests showing a significant overall performance improvement [11]. Finally, we hope to engage more research communities in this important work, in order to progress this promising and exciting technology together.
REFERENCES
[1] E. R. LaChapelle, “The fundamental processes in conventional avalanche forecasting,” J. Glaciol., vol. 26, no. 94, pp. 75–84, 1980.
[2] M. Eckerstorfer, Y. Bühler, R. Frauenfelder, and E. Malnes, “Remote sensing of snow avalanches: recent advances, potential, and limitations,” Cold Reg. Sci. Technol., vol. 121, pp. 126–140, 2016, doi: 10.1016/j.coldregions.2015.11.001.
[3] A. van Herwijnen, N. Berthod, R. Simenhois, and C. Mitterer, “Using time-lapse photography in avalanche research,” 2013, pp. 950–954.
[4] J. S. Deems et al., “Mapping starting zone snow depth with a ground-based Lidar to assist avalanche control and forecasting,” Cold Reg. Sci. Technol., vol. 120, pp. 197–204, 2015, doi: 10.1016/j.coldregions.2015.09.002.
[5] W. Steinkogler, G. Ulivieri, S. Vezzosi, J. Hendrikx, A. V. Herwijnen, and T. Humstad, “Infrasound Detection of Avalanches: operational experience from 28 combined winter seasons and future developments,” Int. Snow Sci. Workshop Proc. 2018 Innsbr. Austria, pp. 621–626, Oct. 2018.
[6] R. Caduff, A. Wiesmann, Y. Bühler, and C. Pielmeier, “Continuous monitoring of snowpack displacement at high spatial and temporal resolution with terrestrial radar interferometry,” Geophys Res Lett, p. 8p, 2015, doi: 10.1002/2014GL062442.
[7] R. O. R. Jenssen, M. Eckerstorfer, and S. Jacobsen, “Drone-Mounted Ultrawideband Radar for Retrieval of Snowpack Properties,” IEEE Trans. Instrum. Meas., pp. 1–10, 2019, doi: 10.1109/TIM.2019.2893043.
[8] S. Leinss, R. Wicki, S. Holenstein, S. Baffelli, and Y. Bühler, “Snow avalanche detection and mapping in multitemporal and multiorbital radar images from TerraSAR-X and Sentinel-1,” Nat. Hazards Earth Syst. Sci., vol. 20, no. 6, pp. 1783–1803, Jun. 2020, doi: https://doi.
org/10.5194/nhess-20-1783-2020.
[9] M. Eckerstorfer, H. Vickers, E. Malnes, and J. Grahn, “Near-Real Time Automatic Snow Avalanche Activity Monitoring System Using Sentinel-1 SAR Data in Norway,” Remote Sens., vol. 11, no. 23, p. 2863, Jan. 2019, doi: 10.3390/rs11232863.
[10]H. T. Larsen, J. Hendrikx, M. S. Slåtten, and R. V. Engeset, “Developing nationwide avalanche terrain maps for Norway,” Nat. Hazards, vol. 103, no. 3, pp. 2829–2847, Sep. 2020, doi: 10.1007/s11069-020-04104-7.
[11]F. M. Bianchi, J. Grahn, M. Eckerstorfer, E. Malnes, and H. Vickers, “Snow avalanche segmentation in SAR images with Fully Convolutional Neural Networks,” ArXiv191005411 Cs Eess Stat, Oct. 2019, Accessed: Oct. 16, 2019. [Online]. Available: http://arxiv.org/
abs/1910.05411.

