By Cam Campbell
This article is from the fall 2005 issue of the Avalanche Journal. It may contain out-dated information and is being presented to showcase past knowledge on the El Niño phenomenon.
Many British Columbians believe that the El Niño-Southern Oscillation index (ENSO) provides a hint of the winter to come. If the index is in a strong El Niño (warm phase), BC’ers gear up for a fat snowpack season. We all remember the winter of 1999: strong El Niño and record snowfall in southwestern BC (Figure 1). This study looks at the validity of using the ENSO and other climatic indices to predict the winter to come. For this study, winter (February 1st) and spring (April 1st) water equivalent of the snowpack (SWE) for seven regions in BC were correlated with four different climatic indices: ENSO, Pacific North American (PNA), Pacific Decadal Oscillation (PDO) and North Pacific (NP).
Motivation for this article came from meteorologist David Jones’ presentation at the 2004 Backcountry Avalanche Workshop on using ENSO as a predictor for West Coast snowfall. In his presentation, David showed that above-average snowfall on the West Coast is sometimes associated with a strong ENSO (warm or cold) but overall the correlation is relatively weak. Several other studies have focused on the relationships between snowpack and hydrologic variability and climatic fluctuations, especially in the Western United States (e.g. Yarnal and Diaz 1986; Cayan and Peterson, 1989; Koch et al., 1991; Redmond and Koch, 1991; Cayan and Webb, 1992; Chagnon et al., 1993; Dracup and Kahya, 1994; McCabe, 1994; Sittel, 1994; Ropelewski and Halpert 1996; Mason and Goddard 2001; Smith and O’Brien 2001; Patten et al., 2003; and the list goes on) but few in Canada (e.g. Moore and McKendry, 1996; Moore and Demuth, 2001).
El Niño-Southern Oscillation (ENSO)
The ENSO index is calculated from the standardized pressure difference between Tahiti and Darwin, a small fishing village on the Chilean coast, and represents the effects of an El Niño event on the strength of the equatorial easterlies (Moore and Demuth, 2001). The occurrence of blocking in the Bering Strait is sensitive to the phase of the ENSO cycle and the frequency of blocking is most strongly influenced by the ENSO in January and February (Renwick and Wallace, 1996).
“Blocking” refers to the breakdown of the prevailing mid-latitude westerly flow in the troposphere which produces persistent ridging over the northeast boundary of the Pacific, effectively blocking fronts associated with cyclonic activity over the Aleutian Islands from reaching BC. Sixty-nine percent more days of blocking occurred during the cold phase of the ENSO cycle than during the warm phase, and the frequency of blocking days is 40% lower during the warm phase of the ENSO compared to other winters (Renwick and Wallace, 1996).
North Pacific (NP)
Trenberth and Hurrell’s (1994) NP index represents the intensity of the Aleutian Low in winter and is the anomaly of the area-weighted mean sea level pressure to the mean between 1925 and 1988 for a given area over the North Pacific. Air temperature has been negatively correlated with the North Pacific (NP) index. That is, warm winters are associated with low NP values, whereas precipitation shows a weak positive correlation with NP (Moore and McKendry, 1996).
Pacific Decadal Oscillation (PDO)
As the name suggests, the PDO index is based on oscillations that occur somewhere in the Pacific Ocean every 10 years or so. In fact, it is the time series scores associated with the leading principle component of sea surface temperature in the Pacific Ocean, north of 20°N (Zhang et al., 1997). A positive PDO (warm phase) represents warmer than average water in the equatorial Pacific and colder than average water in the North Pacific, vice-versa for a negative (cold phase) PDO. Moore and Demuth (2001) found that snow accumulation tends to be greater during PDO cold phase winters, which explains lower observed winter accumulation after 1976 when PDO shifted from its cold phase to the present warm phase.
Pacific North American (PNA)
At 55 years old, the PNA index is the youngest used in this study. The PNA index is a mode of winter atmospheric circulation which is naturally and internally generated (Wallace and Gutzler, 1981). Positive values of the PNA (enhanced phase) represent an enhanced Rossby Wave over Western North America with southerly to southwesterly flow over the West Coast which results in warm advection into the southern Coast Mountains (Moore and Demuth, 2001). Moore and McKendry (1996) found that BC winters dominated by enhanced PNA produced overall shallower than average spring snowpack. Intensification of the PNA index is associated with southwesterly flow over the eastern north Pacific which is likely to cause increased freezing levels and less precipitation, and result in less snow accumulation (Moore and McKendry, 1996).
Methods

The BC Ministry of Water, Land and Air Protection (MWLAP) divided the province into eight regions based largely on major drainages. Figure 2 shows the eight regions and the snow survey sites used in this study. The first thing you’ll notice is a lack of sites in the northern half of BC In fact, no sites were used in the Northeast region due to insufficient data so you can disregard the Northeast. The southern regions, on the other hand, have sites with historical data dating back to the mid-1930s. For the sake of statistical significance an emphasis has been placed on the southern half of the province.
Yearly SWE data collected on, or within a few days of, February 1st and April 1st were obtained from the MWLAP’s River Forecast Centre website. The regional average SWE was determined by averaging the SWEs from all snow survey sites used in that particular region. For the case of the Columbia region this means 11 sites (Figure 2), whereas due to insufficient data only one site was used to represent the Lower Fraser and Northwest regions. In order to maintain spatial bias, the average of all regional average SWEs was used to represent the provincial average.
Table 1 lists the websites from which climatic index data were obtained. Most people would agree that the snow usually starts accumulating in the BC mountains sometime in November. For this reason SWE data on February 1st were correlated with the average index values for the previous three months (November, December and January) and SWE data on April 1st were correlated with the average index values for the previous November to March. In doing this, the total amount of snow on the ground is only compared to the index values of the months during which it accumulated.

Since all the data were normally distributed, Pearson linear correlation analysis was used to describe the associations between SWE and the climatic indices. Pearson’s R statistic describes the strength of the correlation, with a perfect linear correlation represented by R = 1. The p-value is a function of R and the sample size (N) that quantifies the confidence in the correlation. In this case N corresponds to the number of years in which data were available. Multivariate least-squares linear regression was used to describe the influences that two or more variables may have on a single variable. Multivariate regression analysis produces a Coefficient of Multiple Determination (R2), which is essentially an R statistic for linear associations in more than two dimensions. In order to directly compare the results from the two analysis techniques, Pearson’s R statistic was squared. In accordance with most scientific studies, all correlation and regression coefficients were considered statistically significant at the p < 0.05 level. This means that there is a 5% chance of a Type II error where a coefficient is considered to be statistically significant when in fact it is not.
Results
Provincial
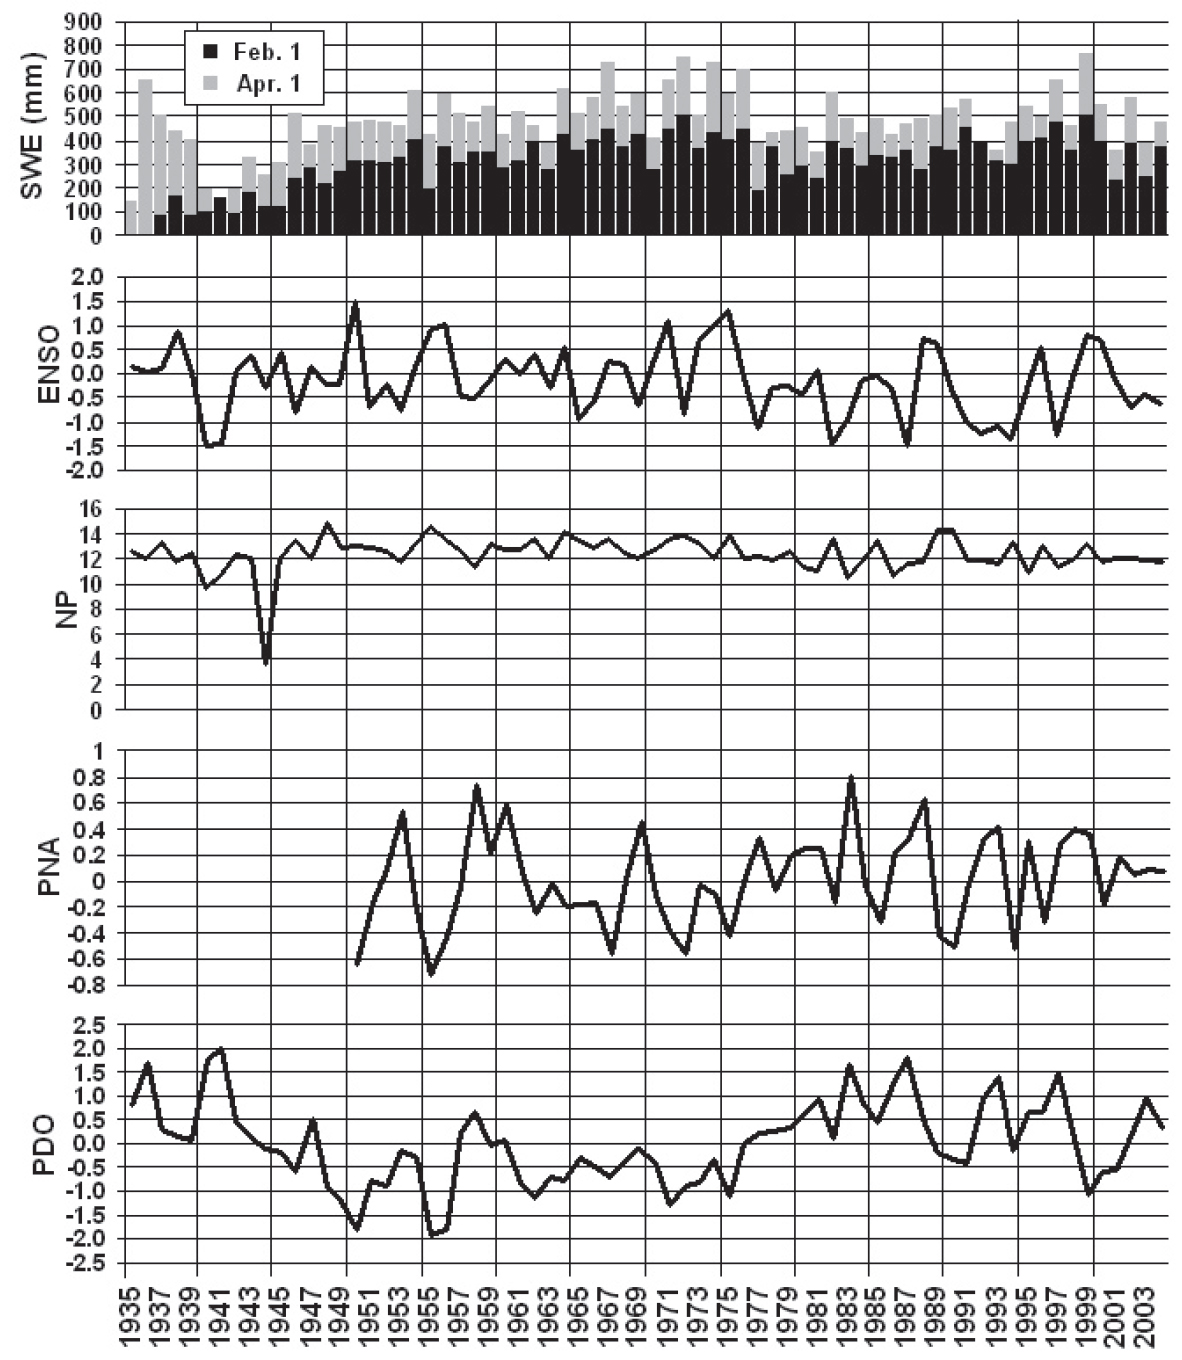
Figure 3 shows time series plots of yearly average PDO, PNA, NP and ENSO indices and provincially averaged SWE for both February 1st and April 1st from 1935 to 2004 (except PNA which doesn’t start until 1950). Consider the three-year period from 1940 to 1942. These winters were characterized by some of the lowest SWE on record and a period of strong La Niña, strong negative NP and strong positive PDO conditions. Now consider the winter of 1999. As mentioned before, this winter was characterized by high SWE across the province which coincides with strong El Niño, strong negative PDO and relatively weak positive PNA and NP conditions. Interpretation of the remainder of Figure 3 will be left up to the reader.
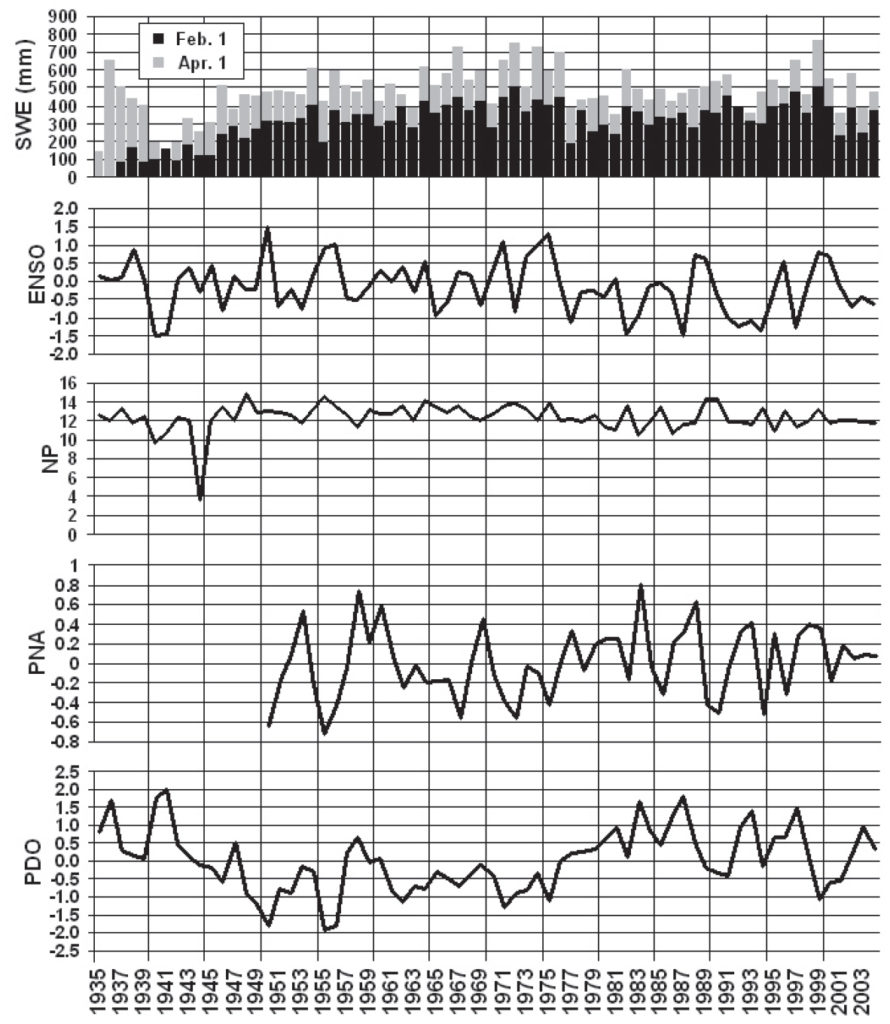
At first glance, it would appear that ENSO’s performance is lacking compared to the other indices (Table 2). The correlation with February 1st SWE wasn’t significant and although significant, the correlation with April 1st SWE was weak compared to the other indices. PNA was the best performer, in terms of predictive merit, for both April 1st and February 1st provincial SWE. It is also interesting to note that the correlations with ENSO and NP are positive (i.e. a strong El Niño or NP index corresponds to a high SWE) whereas the correlations with the other indices are negative. Of course, this cannot be seen in Table 2 as all the correlation coefficients have been squared.
Multivariate least-squares linear regression was used to assess the predictive merit of the top three performing indices combined. In this case, PDO, PNA and NP were used according to the following equation: SWE = aPDO + bPNA + cNP + d (1)
When the three indices are combined, the R2 for February 1st SWE was greater than for any individual index, suggesting that more variability can be explained by combining of PDO, PNA and NP. This, however, is not the case for April 1st SWE, where PNA outperforms the combined indices.

Regional
Once again PDO, PNA and NP in Table 3 seemed to outperform ENSO with more statistically significant correlations and higher overall correlation coefficients. In fact, none of the regions had significant correlations between ENSO and February 1st SWE. All correlations with ENSO and NP are again positive, while all correlations with PDO and PNA are negative. All regions, except the Northwest, had significant correlations between at least one index and February 1st SWE. Once again, PNA seemed to be the best performing index for February 1st SWE, especially for the Thompson, Okanagan-Kettle and Columbia regions. Multivariate least-squares linear regression was again used to assess the combined predictive merit of the PDO, PNA and NP indices based on Equation 1. By combining the three indices, the ability to predict February 1st SWE for all regions, except the Columbia region, was improved. In fact, for the Upper Fraser region the three indices were able to account for 94% of the variability in February 1st SWE.

The first thing you’ll notice is an increased number of significant correlations and overall stronger correlations for April 1st SWE (Table 4) than for February 1st SWE (Table 3). Again, PDO, PNA and NP outperformed ENSO in terms of predictive merit. These three indices were, again, combined for regression analysis. By combining these three indices the amount of variability explained by the linear trends was improved for all regions except the Upper and Lower Fraser regions where NP did a better job alone.

Top Five Sites
The top five performing snow survey sites, in no particular order, are: McBride in the Upper Fraser region; Blue River in the Thompson region; Fidelity Mountain in the Columbia region, Sullivan Mine in the Columbia region; and Fernie East in the Columbia region (Tables 5 and 6). ENSO has once again dropped the ball, PDO, PNA and NP, however, look promising (Tables 5 and 6). Again, the correlations with April 1st SWE were stronger than those with February 1st SWE for all sites and all correlations with ENSO and NP are positive, while PDO and PNA consistently show negative relationships with SWE. Once again, a combination of PDO, PNA and NP did a better job of predicting February 1st (Table 5) and April 1st (Table 6) SWE than any of
the indices alone.


Discussion
The bottom line is: do not rely on ENSO to predict the snowpack depth in the winter to come. The other three indices (PDO, PNA and NP) either alone or combined do a much better job of predicting both February 1st and April 1st SWE at the provincial, regional and individual site scales. Overall, April 1st SWE showed better correlations than February 1st SWE with all four climatic indices. For the most part a combination of PDO, PNA and NP indices will give you the best indication of the winter and spring snowpack to come. For the Upper or Lower Fraser regions in April, your best bet is with NP. Finally, if you like to ski in the Columbia region in February, it’s PNA all the way.
What about the effects of climate change? Well, certainly as our climate continues to change at an accelerated rate, the use of historical climatic data to predict the future becomes less valid. Most climate change models (and there are many) agree that as our climate continues to change, we are going to see more extreme weather patterns. The good news is this means more epic winters like 1999. The bad news is we’ll also see more winters like last year and yes, I realize that it was only extremely bad on the coast. But now that we have these new prediction tools under our proverbial belts we can better decide in the fall whether to buy a new pair of fat boards or spend the money on airfare to South America.
Outlook for next winter? Well, I hesitate to make any predictions because things aren’t looking good and I don’t want to be the bearer of bad news. As of June 2005 the PDO and PNA indices were in a strong positive phase while the NP index was weak, and remember PDO and PNA are negatively correlated with SWE while NP is positively correlated. Anyone interested in a climbing trip to Chile?
Acknowledgements
I would like to thank Dr. Bruce Jamieson for proofreading this article and for providing statistical expertise. I would also like to acknowledge Dr. Dan Moore for providing the idea and proofreading the original draft of this article.
References
Cayan, D.R., and D. H. Peterson. 1989. The influence of North Pacific atmospheric circulation on streamflow in the west. Aspects of Climate Variability in the Pacific and Western Americas, Geophys. Monogr. Ser., 55, 375- 397.
Cayan, D.R., and R. H. Webb. 1992. El Niño/Southern Oscillation and streamflow in the western United States . El Niño: Historical and Paleoclimatic Aspects of the Southern Oscillation. Cambridge University Press, New York, USA. pp.29-68.
Chagnon, D., T. B. McKee and N. J. Doesken. 1993. Annual snowpack patterns across the Rockies: Long-term trends and associated 500-mb synoptic patterns. Mon. Wea. Rev., 121, 633-647.
Dracup, J.A. and E. Kahya. 1994. The relationships between U.S. streamflow and La Niña events. Wat. Resour. Res, 30, 2133-2141.
Koch, R.W., C. F. Buzzard and D. M. Johnson. 1991. Variation of snow water equivalent and streamflow in relation to El Niño/Southern Oscillation. Proceedings of the1991 Western Snow Conference, April 12-15, Juneau, U.S.A. pp. 37-48.
Mason, S. J. and L. Goddard. 2001. Probabilistic precipitation anomalies associated with ENSO. Bull. Amer. Meteor. Soc., 82, 619–638.
McCabe, D. J. Jr. 1994. Relationships between atmospheric circulation and snowpack in the Gunnison River basin, Colorado. J. Hydrol., 157, 157-175.
Moore, R. D. and M. N. Demuth. 2001. Mass balance and streamflow variability at Place Glacier, Canada, in relation to recent climate fluctuations. Hydrol. Processes, 15: 0-0 (2001).
Moore, R. D. and I. G. McKendry. 1996. Spring snowpack anomaly patterns and winter climatic variability, British Columbia, Canada. Wat. Resour. Res, 32, 623-632.
Patten, J. M., S. R. Smith and J. J. O’Brien. 2003. Impacts of ENSO on snowfall frequencies in the United States. Bull. Amer. Meteor.Soc., 18, 965–980.
Redmond, K. T. and R. W. Koch. 1991. Surface climate and streamfl ow variability in the western United States and their relationship to large-scale circulation indices. Wat. Resour. Res, 27, 2381-2399.
Ropelewski, C. F. and M. S. Halpert. 1996. Quantifying Southern Oscillation–precipitation relationships. J. Climate, 9, 1043– 1059.
Renwick, J. A. and J. M. Wallace. 1996. Relationships between North Pacifi c wintertime blocking, El Niño, and the PNA pattern. Mon. Wea. Rev., 124, 2071-2076.
Sittel, M. 1994. Differences in the means of ENSO extremes for maximum temperature and precipitation in the United States. Center for Ocean–Atmospheric Prediction Studies Tech. Rep. 94-2, Florida State University, 50 pp.
Smith, S. R. and J. J. O’Brien. 2001. Regional snowfall distributions associated with ENSO: Implications for seasonal forecasting. Bull. Amer. Meteor. Soc., 82, 1179–1191.
Trenberth, K. E. and J. W. Hurrell. 1994. Decadal atmosphere-ocean variations in the Pacifi c. Clim. Dynam., 9,303-319.
Yarnal, B. and H. Diaz. 1986. Relationships between extremes of the Southern Oscillation and the winter climate of the Anglo–American Pacific coast. J. Climatol., 6, 197–219.
Zhang, Y., J. M. Wallace and D. S. Battisti. 1997. ENSO-like interdecadal variability: 1900-93. J. Climate, 10, 1004-1020.

