Tools to Forecast for Atmospheric Rivers Days in Advance
By Matt Macdonald and Paul Harwood
Note: This article was originally published in The Avalanche Journal, Volume 126, Spring 2021
SOME OF THE BIGGEST SNOWFALLS in western Canada occur when powerful, moisture-laden atmospheric flows from the subtropics lock onto the west coast for a period ranging from 24 to 72 hours. When landfall is preceded by entrenched Arctic air, the result is copious amounts of snow, often in excess of one metre. Previously known as “Pineapple Expresses,” these fire hoses of heavy precipitation are now referred to as atmospheric rivers (ARs) by the meteorological community.
ARs cause significant impacts, including flooding, landslides, and snow avalanches. Recent research has yielded new forecasting resources with impressive accuracy as early as six or seven days out (Figure 1). This article reviews an AR from the 2019-20 winter, focusing on how forecasts performed and what tools are available for AR forecasts and intensity scales.

THE SOLSTICE AR FORECAST
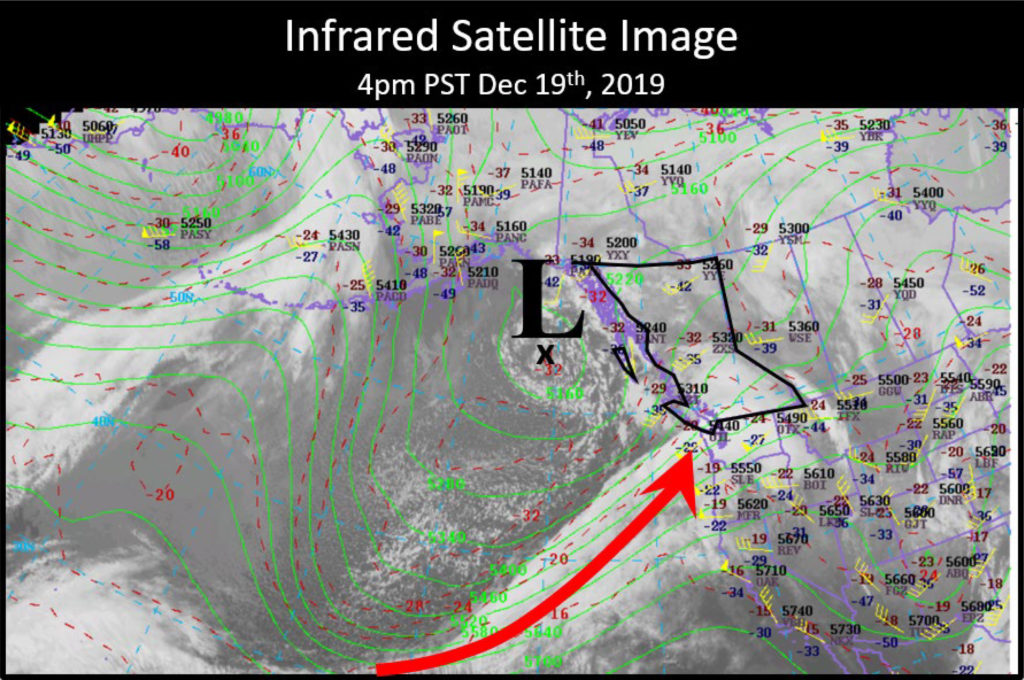
Rewinding our thoughts back to the beginning of the 2019-20 winter, as we approached the winter solstice forecast models, both deterministic and ensembles, were hinting at a very heavy precipitation event some four to five days ahead of expected landfall (see Figures 1 and 2). It’s not at all uncommon for any weather model to paint giant bullseyes of precipitation during the west coast’s storm season. More unusual and impressive was the consistent signal for very heavy precipitation (150-200mm over 36 hours) from models as the event approached, with only slight shifts in the axis of the moisture plume. From six days out, models aimed the core of the AR at the Oregon-Washington border. As landfall drew closer, the target shifted north to Howe Sound before it settled on the North Cascades. Despite the wavering target, successive model runs showed remarkable consistency with both the timing and intensity of the solstice AR, factors that enhance a forecaster’s confidence.
Meteorologists from both the Meteorological Service of Canada (MSC) and the National Weather Service issued early notifications to decision makers some five days in advance of landfall. Following the initial alerts, updates followed via briefings to emergency managers, public facing warnings, media interviews, and posts to social media channels. Working closely with MSC, Avalanche Canada forecasters elevated the avalanche danger across a large swath of mountains spanning from the South Coast all the way through to the South and Central Rockies (Figure 4).
Given their subtropical origins, ARs not only deliver heavy moisture, but ample heat as well. The main uncertainty surrounding the 2019 winter solstice AR was the ultimate peak of freezing levels across the North Cascades, including the Mount Baker ski resort (top lift reaches 1,550m), Allison Pass along BC Highway 3 (1,342m elevation), and the Coquihalla Highway (1,220m elevation). Forecast peak freezing levels varied from as high as 1,700m from the Canadian Global Deterministic System (GDPS) to as low as 1,100m from the cold-biased American Global Forecast System (GFS).

DIABATIC COOLING
With increased resolution and enhanced microphysical schemes, weather models have significantly improved in recent decades. Fortunately, forecasters’ pattern recognition skills, knowledge of local effects, and interpretation of numerical weather prediction have also kept pace. In terms of mountain meteorology, one key improvement has been the theorized and documented thermal effects associated with high precipitation rates.
At the onset of falling rain or snow, the precipitation often evaporates or sublimates as it enters drier air below. The phase change of evaporation (liquid water to vapour) or sublimation (ice crystal to vapour) robs the surrounding environment of heat, resulting in a net
cooling effect. When precipitation rates are high enough, as with ARs, this diabatic cooling can be strong enough to change rain into snow. Pronounced diabatic cooling can lower snow levels by 200–400 metres, resulting in heavy snowfall and busting cold rain forecasts for the non-astute meteorologist.
During the 2010 Winter Olympic Games in Vancouver and Whistler, the diabatic cooling theory was tested and fine-tuned by lead forecaster Trevor Smith, aka “Diabatic Dude,” a regular contributor and co-creator of the Avalanche Canada Mountain Weather Forecast. Applying diabatic cooling adjustments to the models, MSC forecasters can now accurately forecast snow as opposed to rain at pass elevations of the North Cascades. (Admittedly though, not enough snow…)

THE SOLSTICE AR
In the end, the solstice AR aligned from the Olympic Peninsula in Washington through the North Cascades and into the South Columbias. It delivered anywhere from 60–130cm of snow, including a new 24-hour snowfall record at Allison Pass of 107cm, with a water equivalent of 68mm. Temperature-wise, freezing levels peaked at 1,200m elevation, resulting in most of the precipitation falling as snow at pass elevations and above. As far as forecasts go, particularly long-range forecasts of atmospheric rivers, this one verified pretty darn well.
While hindsight is often 20/20, despite the early notification to decision makers and highway managers, the impacts to the transportation corridors of the North Cascades were significant. With snowfall rates exceeding 10 centimetres per hour, snowplowing, towing and rescue capabilities ultimately got overwhelmed. The Coquihalla experienced multiple motor vehicle incidents and closures during the storm. In Allison Pass, dozens of vehicles were stuck and stranded as the highway was closed for 47 hours. One person died in an accident near Paulson Bridge on Highway 3 in the West Kootenays. These situations could likely have been avoided, or at least reduced, with better planning and outreach.
This AR had the potential to produce a historic avalanche cycle. Fortunately, the storm came on the heels of the slowest starting winter on record in the North Cascades. There was little snowpack to contribute additional mass to avalanches and the tracks still had significant surface roughness. This limited the size of avalanches and how far they were able to travel. Combined with catchment areas, defense structures, and ditches still being empty, few avalanches were able to reach the highways.

FORECASTING FOR ARS
Recent research has shown both the frequency and intensity of ARs are expected to increase in our changing climate. Fortunately, the accuracy and lead time from AR forecasting tools are also improving and are now readily available to the public. Sources for automated AR forecasts include the Center for Western Weather and Water Extremes (CW3E, https://cw3e.ucsd.edu/). Commentary and probabilistic discussions are also available throughout the winter from MSC forecasters via the Day 5-7 tab of the Avalanche Canada Mountain Weather Forecast (www.avalanche.ca/weather). The tab is updated every Monday afternoon and remains available until Monday at midnight the following week.
In an attempt to better communicate the forecast severity and potential impacts associated with ARs, new classification scales have been developed and proposed by CW3E. A Canadian version has been produced collaboratively by BGC, an applied earth science engineering firm, and Environment and Climate Change Canada. Analogous to the Saffir-Simpson scale for hurricanes, the AR classification scale ranks atmospheric rivers from one to five, with categories described as weak, moderate, strong, extreme, and exceptional.
As with any forecast tool, regular use will help the user gain familiarity and develop a sense of what the associated impacts might look like for their operation or corner of the world. Consider adding the ensemble-based AR forecasts from CW3E to your list of bookmarks. With several days notice from modern atmospheric river forecast models and the accompanying guidance from meteorologists, we can aim to better prepare for these major precipitation events as opposed to chasing our proverbial tails in reactive mode.


